Silver Rises Over 120% YTD


Gold Fell 3.4% This Week. The Long-Term Case Didn’t.

Gold fell 3.4% in the week ending July 17 — its largest weekly decline since June 1. Six days of U.S.-Iran escalation drove oil up 12%, repricing Fed rate-hike odds and pressuring gold to $3,968. Banks cut their 2026 average forecasts. Asia’s physical buyers did the opposite — and the structural case for gold ownership remains intact.
Manufacturing Just Had Its Best Month of 2026. Gold Just Had One of Its Worst Days.

The Philadelphia Fed manufacturing index hit 41.4 in July — its strongest reading in years and more than three times the consensus of 13. Gold fell 2.2% on the news. The mechanism behind that move is the entire story.
Silver Dropped 1.4% Today. Gold Didn’t. The Ratio Just Hit 70:1.
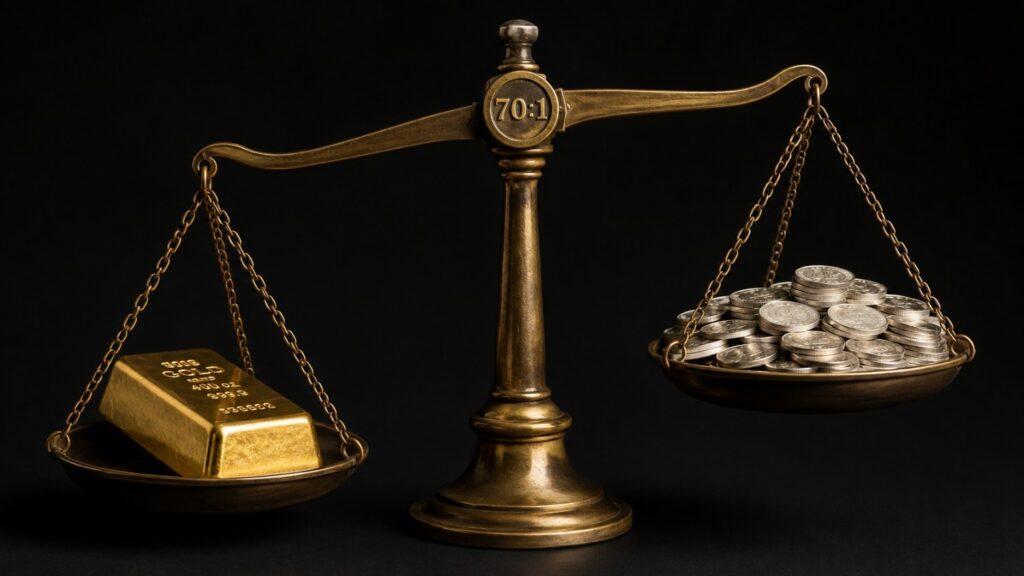
The gold-silver ratio hit 70:1 today as silver fell 1.4% while gold held essentially flat. Here is the mechanism behind the divergence — and the two dates that will likely close the gap.
Trump’s Hormuz Toll Is an Inflation Tax. Here’s Why Gold Fell.

Trump’s 20% Hormuz toll sent oil higher and gold to $4,005. Here’s the exact four-step mechanism connecting a shipping levy to a falling gold price — and why the same inflation it creates is the long-term case for owning physical metal.
Gold Is Closing Its Worst Quarter Since 2013. A War Made It Happen.
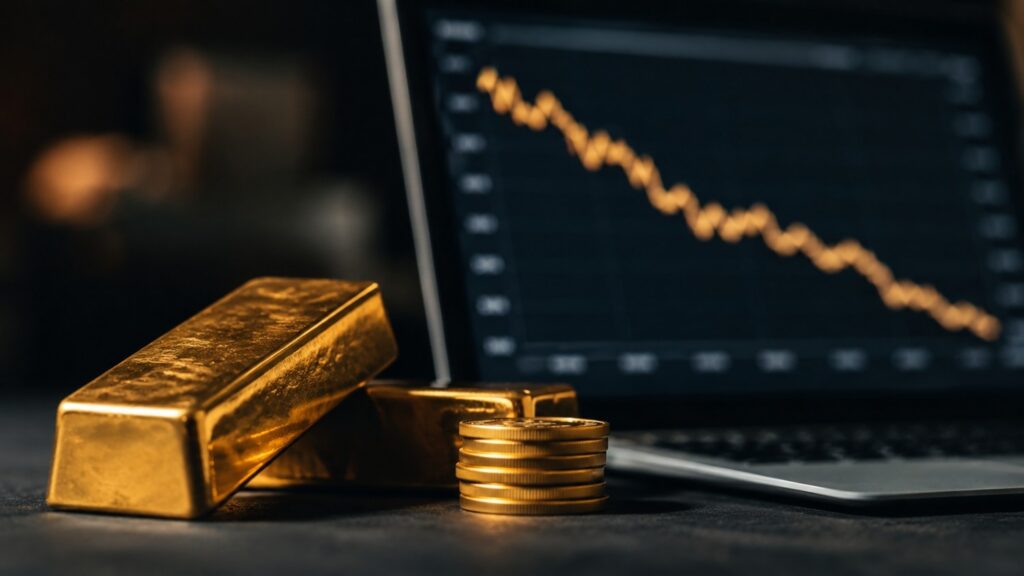
Gold entered Q2 at around $4,700. It is leaving at $4,015. That is the worst quarterly decline since the 2013 taper tantrum — and the cause is a war, not despite one.
298 Tonnes of ETF Gold Is Underwater. Central Banks Aren’t.
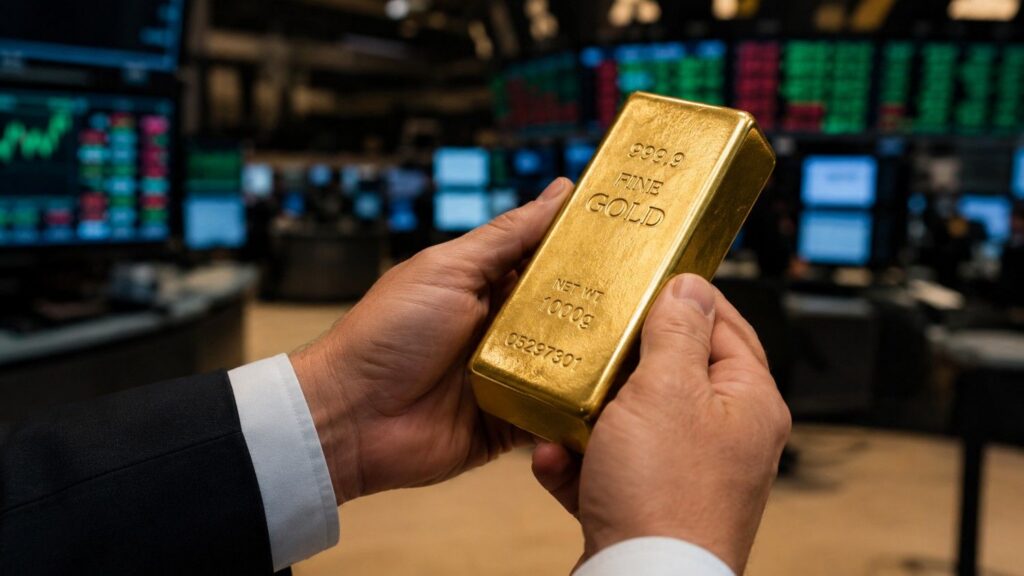
Approximately 298 tonnes of gold inside ETFs is currently held at a loss at current price levels — a structural ceiling on any near-term recovery. At the same time, the WGC’s 2026 survey found a record 45% of central banks plan to add to their reserves. Two markets. One metal. Very different time horizons.