 Silver Rises Over 120% YTD




Gold Beat Inflation by 15,000%. Here’s the Catch Nobody Mentions.

Central banks made gold the world’s largest reserve asset in 2026, and 84% now cite it by name as a store of value. This piece walks through the purchasing-power math, the survey data behind that shift, and gold’s honest volatility record.
Precious Metals in Portfolio Diversification
Key Takeaways Gold maintained a correlation of just 0.14 with global equities over the past 20 years. That is effectively zero. It tends to hold value when other assets fall together (World Gold Council). Central banks purchased 863 tonnes of gold in 2025. That was the fourth-largest annual expansion of official gold reserves on record, at near-record prices (World Gold Council). When core inflation exceeds 2.5%, the negative correlation between US stocks and Treasuries begins to break down. That removes the diversification benefit that justified the 60/40 portfolio for decades (World Gold Council). World Gold Council portfolio simulations show gold […]
Real Wealth vs Paper Wealth
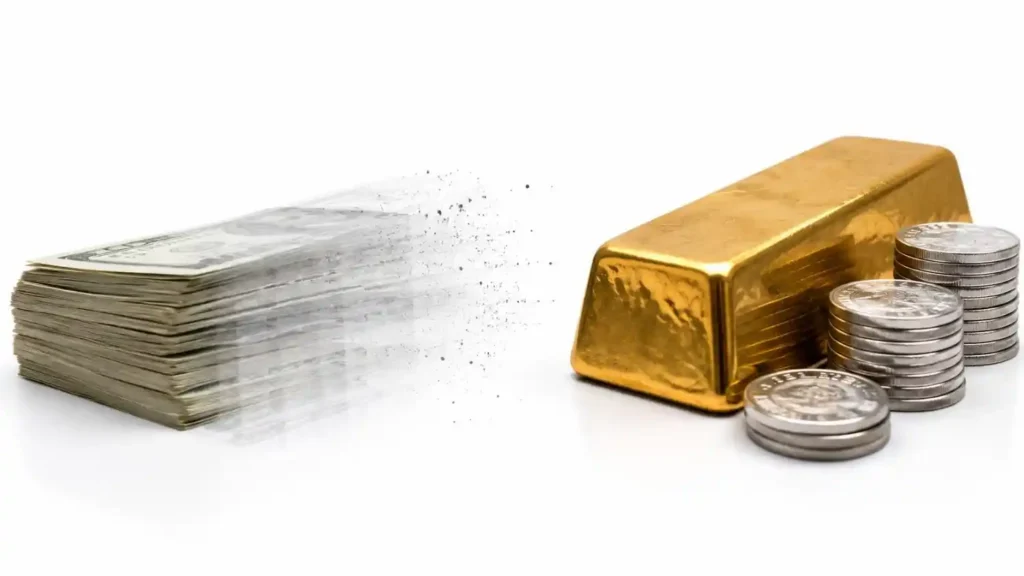
Key Takeaways Real wealth is purchasing power — what your money can actually buy — not the number on a screen. The U.S. dollar has lost approximately 88% of its purchasing power since 1971, when it was severed from gold. (Bureau of Labor Statistics, CPI-U) Paper wealth grows in nominal terms while real wealth — what those numbers actually command — quietly shrinks. Gold and silver are money, not currency: they store the value of past work without a central authority printing it away. The Dow Jones Industrial Average cost roughly 20 ounces of gold in 2019 and approximately 10 […]
Generational Wealth Transfer with Precious Metals

Key Takeaways An estimated $124 trillion will transfer between generations by 2048 — the largest intergenerational wealth handoff ever recorded. Physical gold is one of the few inherited assets that arrives without counterparty risk, dilution, or management obligation. (Cerulli Associates, U.S. High-Net-Worth and Ultra-High-Net-Worth Markets 2024) Inherited physical gold receives a step-up in cost basis to fair market value at the date of death, eliminating decades of capital gains tax liability for heirs. (IRS, IRC § 1014) The 2026 federal estate tax exemption is $15 million per individual, or $30 million per married couple, under the One Big Beautiful Bill […]
Dow-to-Gold Ratio

Key Takeaways The Dow-to-Gold ratio divides the Dow Jones Industrial Average by the gold spot price, stripping out the dollar to show real relative value between stocks and hard money. The ratio’s long-run average since 1971 is about 15 (MacroTrends). Every sustained reading well above 15 has preceded a gold bull market; every sustained reading below 5 has preceded equity outperformance. As of early July 2026, the ratio stands near 12.7 — down sharply from its 2022 high near 20, reflecting gold’s structural outperformance over that period. It remains below the long-run average. The ratio moves for two reasons: changes […]
Gold vs Bitcoin
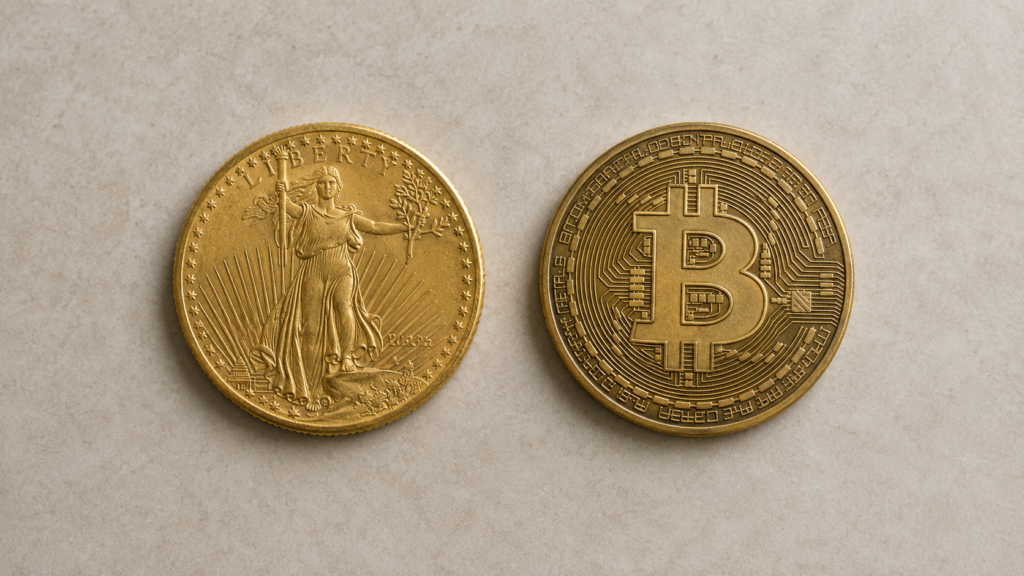
Key Takeaways Gold’s supply is limited by geology; Bitcoin’s is capped by code at 21 million coins. Roughly 216,265 tonnes of gold sit above ground worldwide, as of year-end 2024 (World Gold Council). Both are bearer assets. Whoever holds them controls them, and there’s no institution to appeal to if they’re lost or stolen. Bitcoin is pseudonymous, not anonymous. Every transaction is permanently visible on a public ledger. Spot Bitcoin ETFs, launched January 2024, and the 2024 halving have reshaped Bitcoin’s market structure, but not its underlying bearer-asset risks. Bitcoin still behaves more like a volatile store of value than […]
Gold vs Real Estate

Key Takeaways The median US home costs about 106 ounces of gold as of July 2026, based on a $429,300 median price (NAR, May 2026) and gold near $4,033/oz (World Gold Council; LBMA). This is down sharply from the 2001 peak, when estimates range from roughly 450 to 545 ounces depending on methodology (Amerman; PricedInGold.com). Gold and real estate respond to different mechanisms: housing tracks mortgage rates and credit availability, while gold tracks real yields and currency debasement. Real estate’s carrying costs, including property tax, insurance, and maintenance, commonly run 2–4% of home value annually (Tax Foundation; US Census Bureau). […]
Purchasing Power Over Time

Key Takeaways In August 1971, one ounce of gold bought 2.94 dinners at London’s Savoy Grill. By January 2026, it bought 13.98 — a 4.75x increase in real purchasing power over 55 years (Equitile Investments, “The Savoy Gold Ratio,” January 30, 2026). The US dollar has lost over 96% of its purchasing power since 1913. One ounce of gold has tracked the price of a quality men’s suit for the entire century (Bureau of Labor Statistics, CPI Historical Data). The purchasing power of gold is anchored by supply scarcity — gold production grows at roughly 1.5–2% per year, closely matching […]
What are precious metals
what are precious metals


