Gold/Silver Price Chart
The gold/silver ratio (GSR) is the current price of an ounce of gold divided by the current price of an ounce of silver.
Home / Price Charts / Gold/Silver Ratio Price Charts
Gold/Silver Ratio Live Price
Gold / Silver Ratio Guide
The gold / silver ratio. It’s simple: Take the price of an ounce of gold and divide it by the price of an ounce of silver. Presto; the resulting number is the gold / silver ratio.
The ratio is most useful at its extremes. When the ratio has topped 80, it has signaled a time when silver was relatively inexpensive relative to gold. Silver went on to rally 40%, 300%, and 400% the last three times this happened.
Likewise, the three times the gold / silver ratio has fallen below 20 in the past, it has marked a period when gold was relatively inexpensive compared to silver.
This is the best of savvy investment strategy; take a simple mathematical equation and track historical price behavior. When relative valuations hit extremes and then revert to historical means time and time again, we seek to buy these temporary undervaluations and wait for their inevitable pendulum swing in the opposite direction.
Gold Price
Silver Price
Explore ourGold / Silver Products
Explore our Latest Insights
Calculated Return on Investment Metals
Select Your Metal
Investment Amount
Time
Invested Amount
$ 0
Gain/Loss
$ 0
$ 0
$ 0
$ 0
Total Return
$ 0
$ 0
$ 0
$ 0
Frequently Asked Questions
What Is the Gold/Silver Ratio and Why Is It Important?
The gold/silver ratio represents the number of silver ounces needed to purchase one ounce of gold. This ratio is a key metric watched by precious metals investors and traders to identify potential investment opportunities.
Calculation: Gold/Silver Ratio = Price of Gold per Ounce ÷ Price of Silver per Ounce
What is the Typical Gold/Silver Ratio Throughout History?
Throughout history, gold has consistently commanded a higher value than silver, with the ratio fluctuating significantly over time
- In ancient civilizations, the ratio was often fixed at 12:1 or 15:1
- During the modern era (post-1900), the ratio has generally oscillated between 50:1 and 80:1
- Extreme readings have occurred: the ratio reached nearly 100:1 during the 2020 market turbulence and fell to almost 20:1 in 1980
How Do Investors Use the Gold/Silver Ratio Today?
The gold/silver ratio is a practical tool for precious metals investors. Traders use it to time their entry and exit points, particularly when the ratio reaches extreme levels. Investors also use it to make strategic decisions about rebalancing their precious metals holdings – often buying silver when the ratio is high and gold when it’s low. Additionally, significant movements in the ratio can signal broader market stress or economic uncertainty, making it a useful indicator for portfolio management.

News and Updates on Gold Market

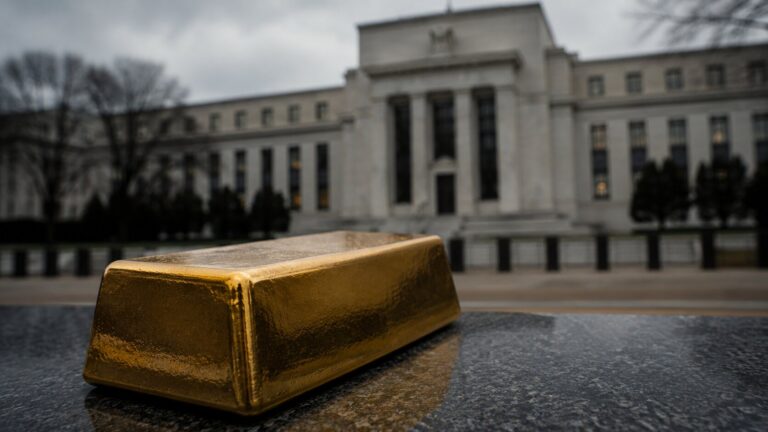
Goldman Cut Its Gold Target. JPMorgan Didn’t. Here’s What the $1,400 Gap Tells You.
Goldman Sachs just cut its year-end gold forecast to $4,900. JPMorgan didn’t move. Neither did Wells Fargo. The $1,400 divergence between the biggest bulls and the biggest skeptic tells you exactly what each bank thinks gold actually is, and why it matters for how you hold it.

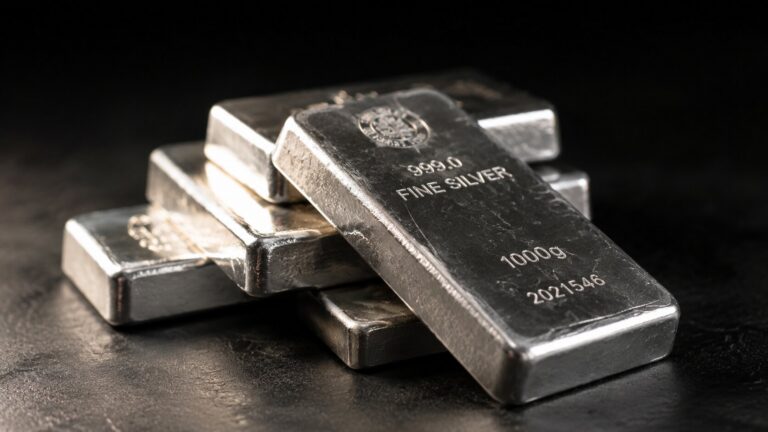
Solar Is Using 19% Less Silver. The Deficit Is Getting Worse. Here’s Why That’s Bullish.
Solar photovoltaic manufacturers reduced silver consumption by 19% in 2026, to roughly 151 million ounces. Despite that reduction, the global silver market is heading for its sixth consecutive annual supply deficit of 46.3 million ounces — wider than the year before. The deficit is expanding because mine supply is contracting faster than industrial demand is falling.

TIPS Protect Against Inflation. Gold Protects Against More.
TIPS and gold both claim to hedge inflation — but they work through opposite mechanisms and fail in different scenarios. Here is the honest comparison every long-term investor needs to understand.


