Is Now a Good Time to Buy Gold? Here’s the Macro Case
Gold has pulled back 13–14% from its January all-time high of $5,589. The dollar is weakening, the IMF has cut its growth forecast, and central banks bought 863 tonnes of gold in 2025. Here’s what the macro picture is signaling.
Dow to Gold Ratio: 100 Years of History Decoded
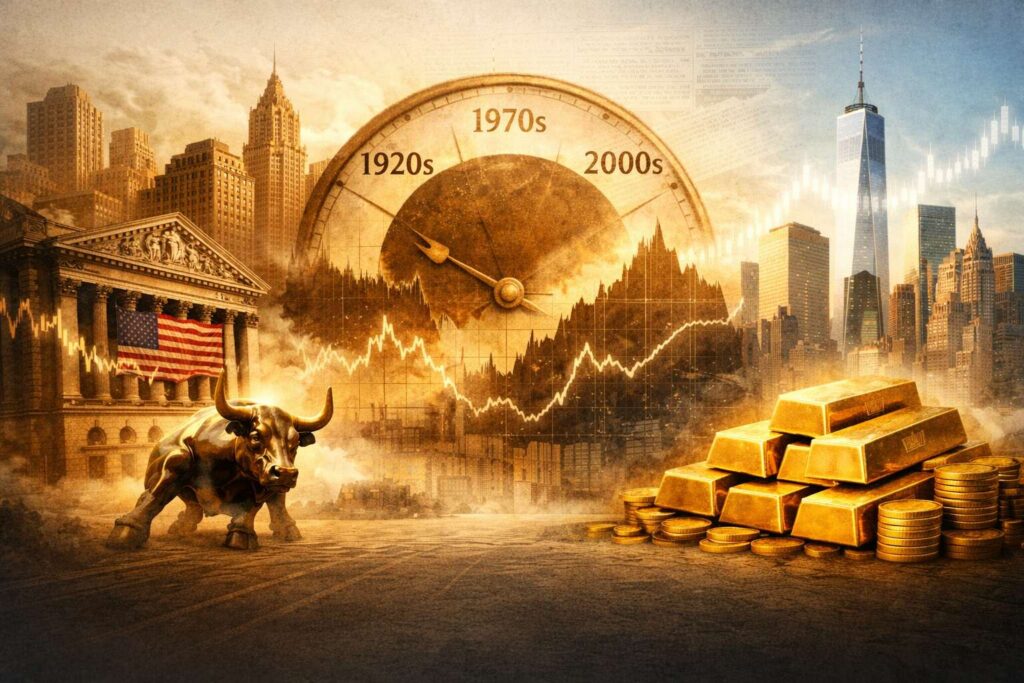
Gold has gained roughly 15.6% since January 1, 2026, while the Dow is up just 2.7% over the same stretch. That gap doesn’t register in most financial headlines — but the Dow to gold ratio captures it with precision. Right now, the ratio reads approximately 10: it takes around 10 ounces of gold to match one unit of the Dow index. At the dot-com peak in 1999, it took 43. What does that shift tell us, and where does it go from here?
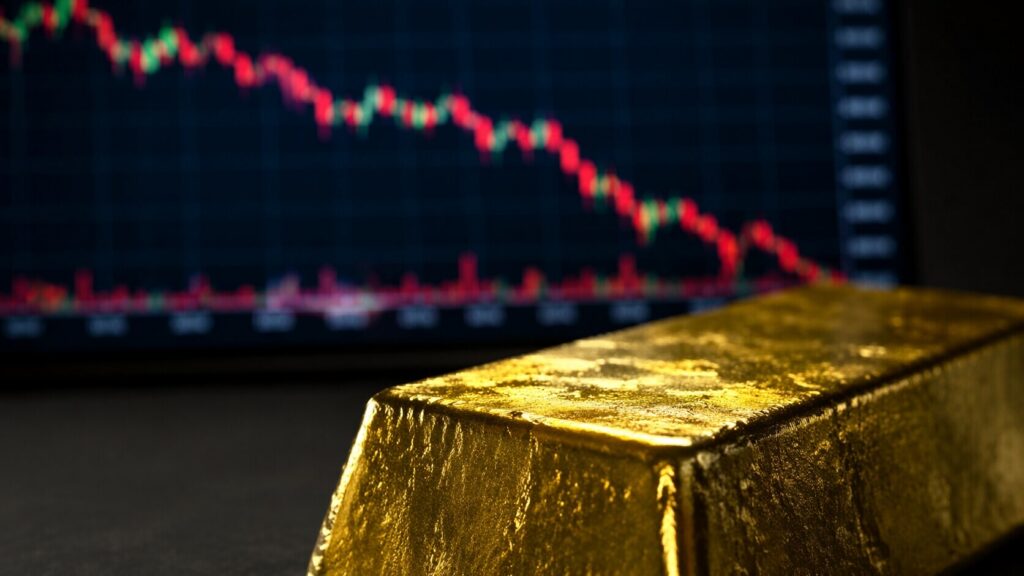
Is the Gold Price Correction Over? What This Rebound Tells Us

Gold and silver rebounded ~3% Friday, but the gold price correction extends to 17% off January’s all-time high. Here’s what’s driving the selloff — and what a reversal could look like.
Do You Own Enough Gold? 5 Economic Signals That Say the Answer Is No

Five gold economic signals — shipping disruptions, $110 oil, $39 trillion in US debt, elevated Treasury yields, and a gold pullback from its all-time high — are converging to make the structural case for precious metals stronger than ever. GoldSilver breaks down what each signal means and the one question every investor should be asking right now.
Gold Just Closed Above $5,000. What Happens Next?
Gold has officially posted a weekly all-time high above $5,000, signaling sustained momentum rather than short-term volatility. History shows that clusters of record weekly closes often occur during the strongest phases of a bull market. From the 1970s surge to today’s extended streak, past cycles suggest the most explosive gains have historically come later — not earlier. Could this pattern point toward a powerful final phase into 2027?
