Does Timing the Gold Market Work? What 56 Years of Data Shows
Most investors try to avoid buying gold at the wrong time—but decades of data show that timing the gold market can quietly destroy returns. The vast majority of gold’s long-term gains come from just a handful of unpredictable trading days each year. Miss them, and performance collapses. This analysis reveals why staying invested—not timing entries and exits—is the only reliable way to capture gold’s full return potential.
Gold ETFs Are Booming. But Do You Actually Own Gold?
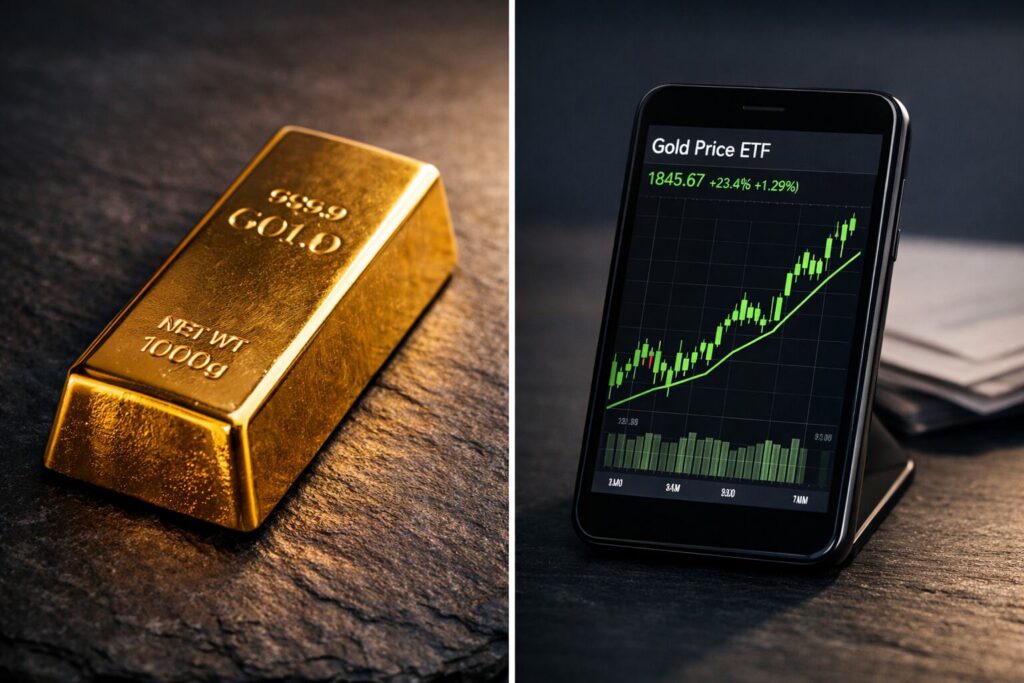
Gold ETF inflows are rising, but are investors getting the protection they think? This guide breaks down the real differences between gold ETFs and physical gold — covering counterparty risk, long-term costs, liquidity, and what each option actually delivers when markets are under stress. If gold is in your portfolio to do a job, here’s how to make sure you’re holding the right version of it.
Should I Buy Gold Now? What Most Investors Get Wrong

Most investors ask the wrong question about gold. It’s not just when to buy — it’s why, how, and how much. This guide breaks down the key factors most people overlook, from choosing the right investment vehicle to building the right allocation for your risk profile, so you can make a smarter, more confident decision about investing in gold today.
UBS Forecasts Gold Above $6,000 — Should You Buy Now?

UBS forecasts gold to rise 20% by end-2026, targeting $5,900–$6,200 per ounce. Learn what’s driving the rally, whether now is the right time to buy, and how to position your precious metals portfolio for maximum impact.
Gold’s Worst Week in 46 Years: Should You Be Worried?

Gold just recorded its worst week in 46 years, dropping over 10% in a single week and 17% in three. But history shows these rare selloffs don’t end bull markets—they often precede the next leg higher. Here’s what’s really driving the decline and what investors should do next.
Gold Investment Strategies: Dalio vs. Buffett vs. Rogers

Ray Dalio recommends up to 15% in gold. Warren Buffett calls it non-productive. Jim Rogers says buy it when nobody wants it. Three legendary investors, three completely different frameworks — here’s what their disagreement reveals about gold’s real role in your portfolio.
Is Gold in a Bubble? What Kiyosaki’s $35K Forecast Tells Us
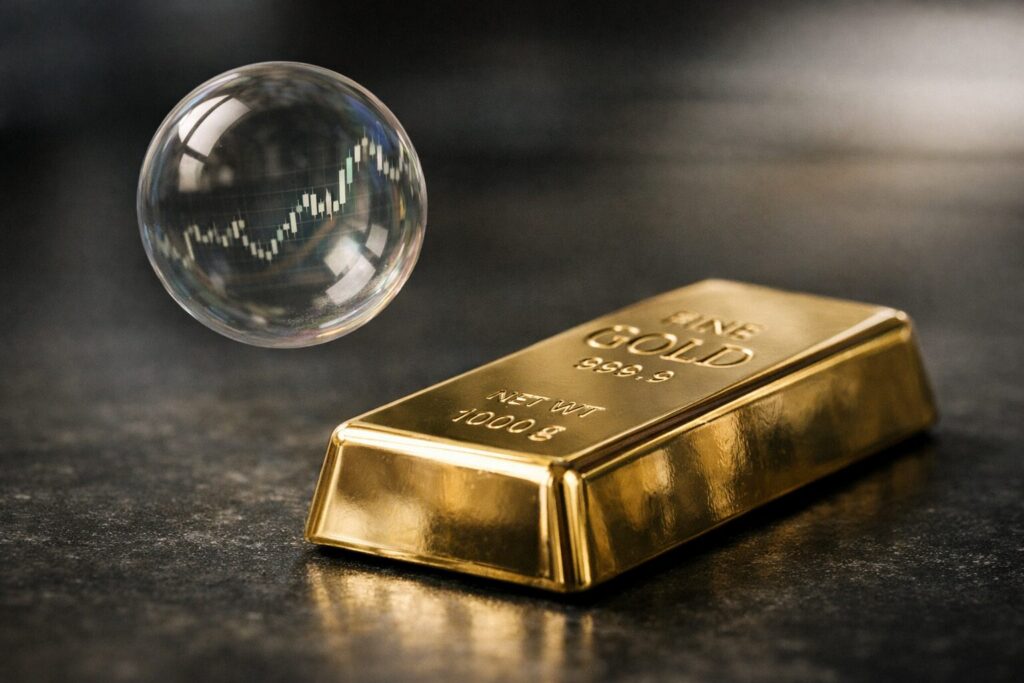
Gold has surged past $5,000 an ounce — but is it a bubble or a bull market? We break down what’s driving prices, evaluate Robert Kiyosaki’s dramatic $35,000 forecast, and explain what investors should actually do with their precious metals allocation right now.
Why Metals Dominated Every Asset Class in 2025 [and What It Means for 2026]
![Why Metals Dominated Every Asset Class in 2025 [and What It Means for 2026]](https://goldsilver.com/wp-content/uploads/2026/01/gold-silver-performance-2025-1024x683.jpg)
Gold and silver didn’t just perform well in 2025 — they dominated every major asset class. With silver up 146% and gold rising 64%, metals sent a clear signal about where investors placed their trust during a year defined by uncertainty.
London Gold Fixing: Key Factors That Influence Global Gold Prices
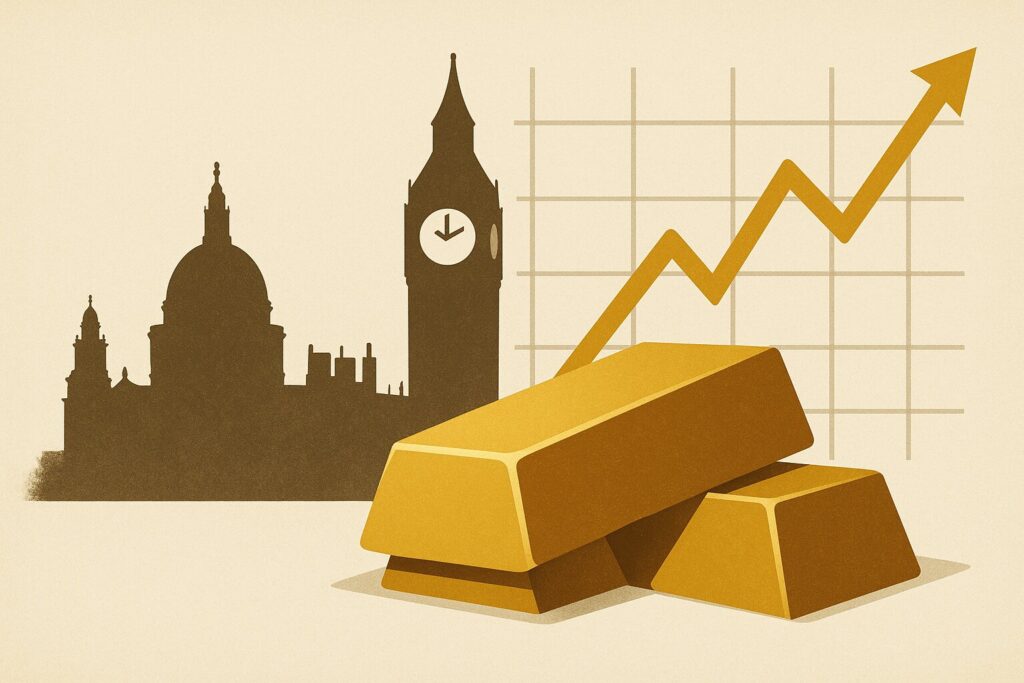
For more than a century, the London Gold Fixing—now the LBMA Gold Price—has set the benchmark that guides global gold transactions. Today’s transparent, twice-daily electronic auctions reflect real-time supply and demand, shaped by central bank policies, inflation, currency movements, geopolitics, and physical market fundamentals. Understanding these forces helps investors interpret price movements and make more informed decisions in the precious metals market.
Gold Price Prediction 2026: 5-Year Investment Outlook
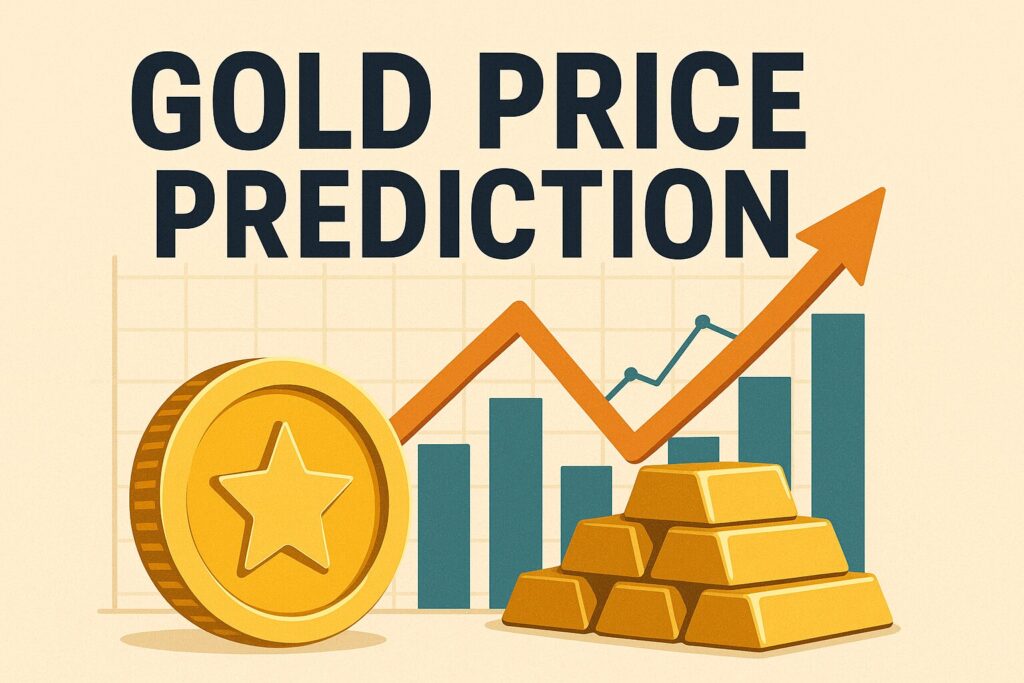
Gold Price Prediction 2026: Gold has shattered records above $4,000 per ounce, fueled by central bank demand, inflation, and global uncertainty. With major banks now projecting $5,000 gold by 2026, investors are asking how much higher this bull market can go — and how to position their portfolios for the next five years.
