 Silver Rises Over 120% YTD




FOMC Minutes Tomorrow. Jackson Hole in Nine Days. Here Is What Gold Needs From Both.
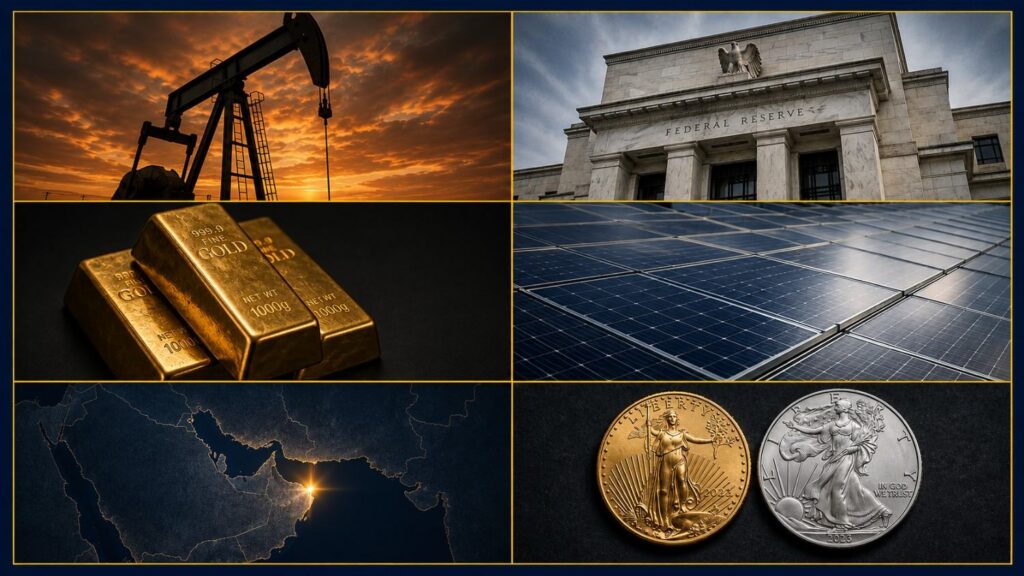
Gold is at $4,390 and silver at $64.74 as five forces hit the market at once. The Iran ceasefire expired. FOMC minutes drop tomorrow. Warsh speaks at Jackson Hole in nine days. Central banks just recorded the strongest Q2 gold buying on record. And silver is falling harder than gold — here is why each move matters.
Oil Spiked 8%. Gold Went Up Anyway. Here Is Why This Time Is Different.
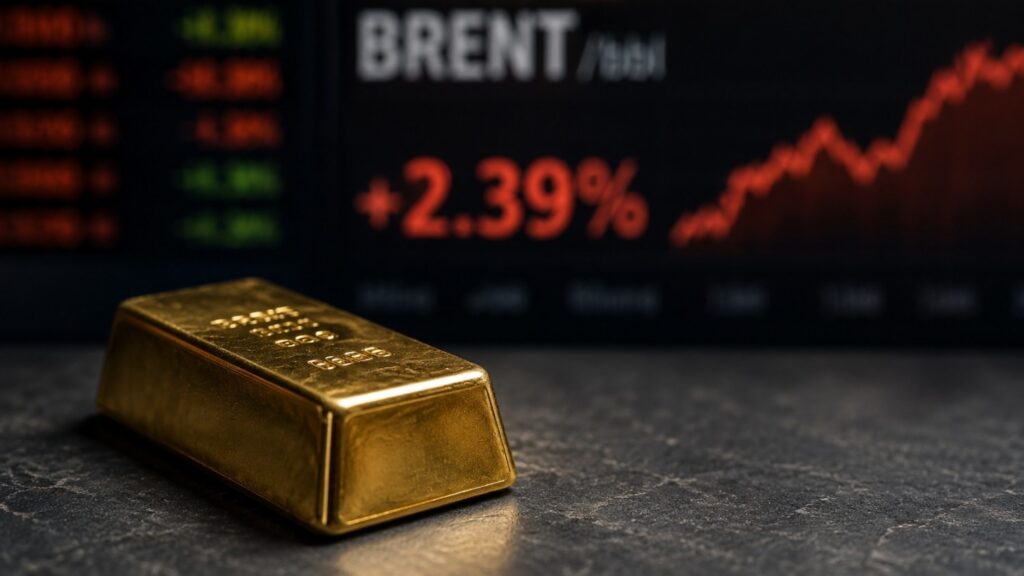
Brent crude surged 7.9% on July 29 after Iran fired missiles at US forces. Gold rose anyway. Here is why the standard suppression chain broke — and what the US Strategic Petroleum Reserve’s 43-year low means for every future oil shock.
Gold Is Flat. Oil Is Up 9%. Here’s Why.
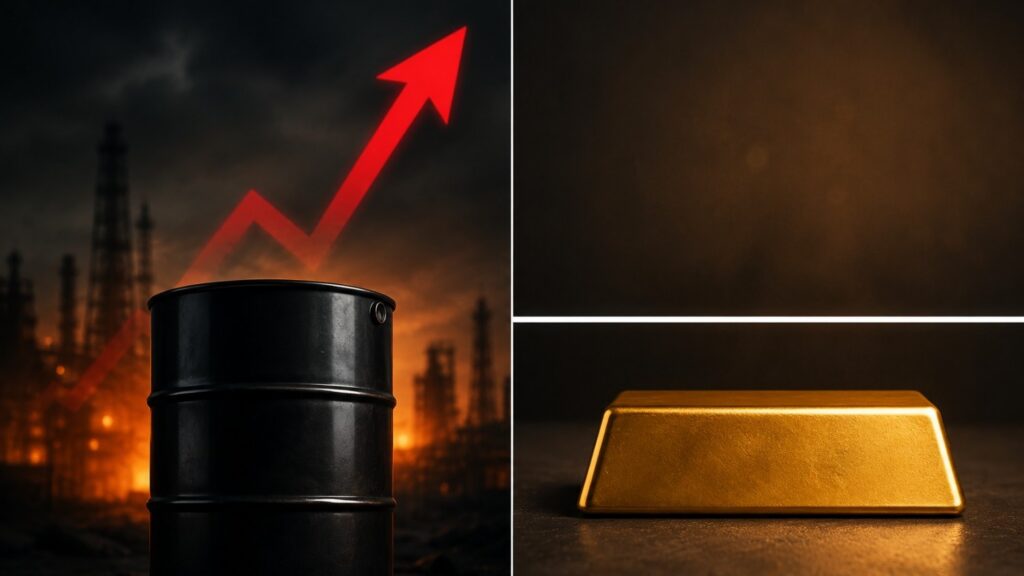
Oil is up more than 9% in five days. The Strait of Hormuz is nearly closed. Gold is flat. That is not a contradiction — it is the difference between supply-chain inflation and monetary inflation, and it matters for every long-term holder.
Gold Near $4,330 as Rate-Hike Bets Hit 70% and China Acts
Five forces are moving gold and silver right now. Strong U.S. jobs data has pushed Fed rate-hike odds above 70%. China’s biggest banks raised gold trading margins to 120% — pushing leverage below 1x. The People’s Bank of China extended its buying streak to 19 straight months. Iran announced an end to its military operation against Israel, steadying metals after last week’s 5% pullback. And elevated oil is keeping inflation expectations alive. Here is what each one means for long-term precious metals holders.
Gold to Oil Ratio: The Ultimate Guide for Economic & Portfolio Analysis
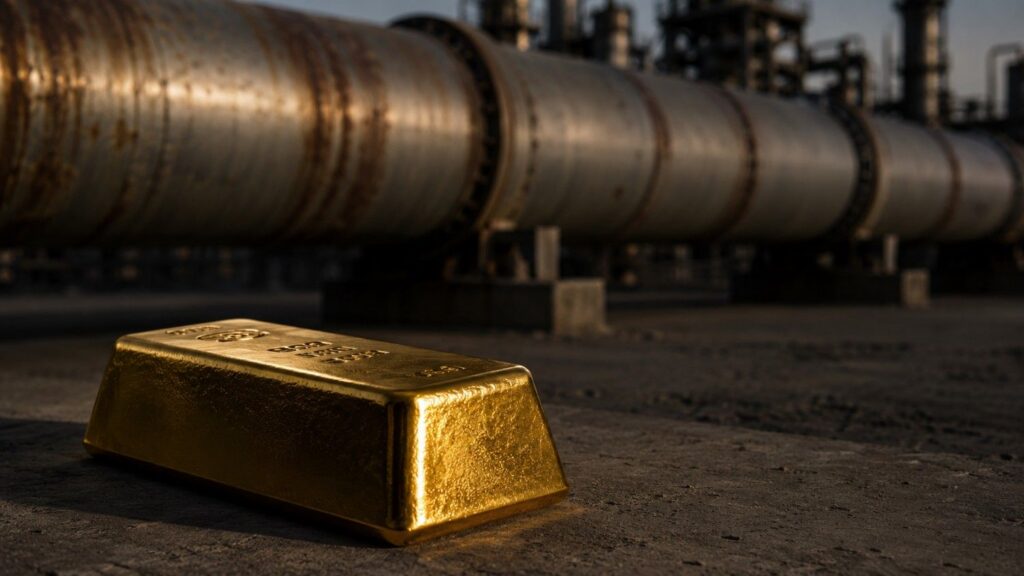
The gold-to-oil ratio has tracked monetary and economic conditions for over a century. This guide explains how to calculate it, what its historical range means, how it signals inflation and dollar risk, and how to use it as a practical portfolio analysis tool — without relying on a single day’s prices.
Gold, Oil, and the Fed: Why the Old Rules Don’t Apply
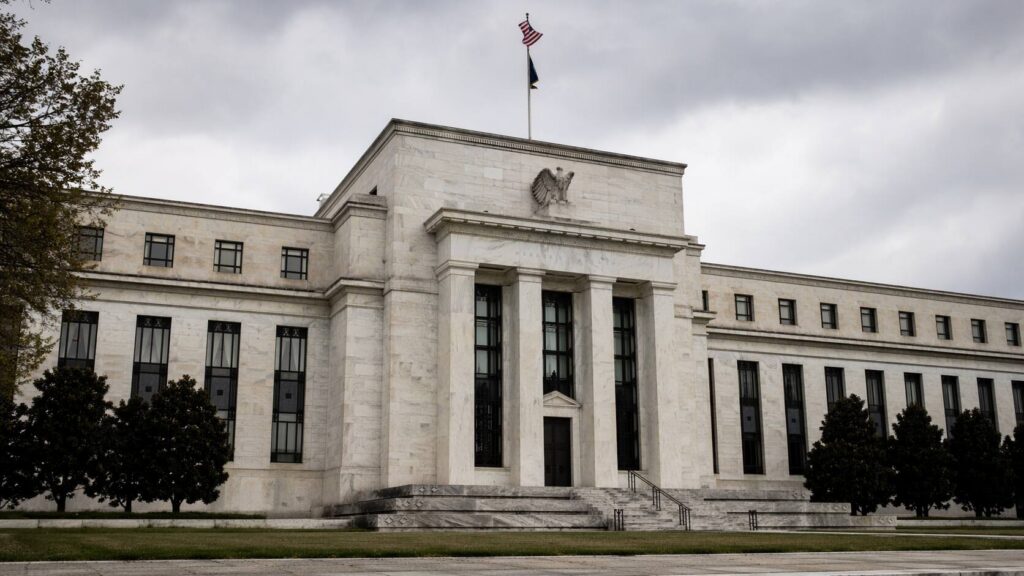
Gold is down, oil is surging, and the Fed is frozen. If that seems contradictory, it isn’t — once you understand how real yields work. Five briefs explain exactly what’s driving markets on April 29, 2026.
Oil Hits $100 and OPEC Is Fracturing. Gold Knows Why.
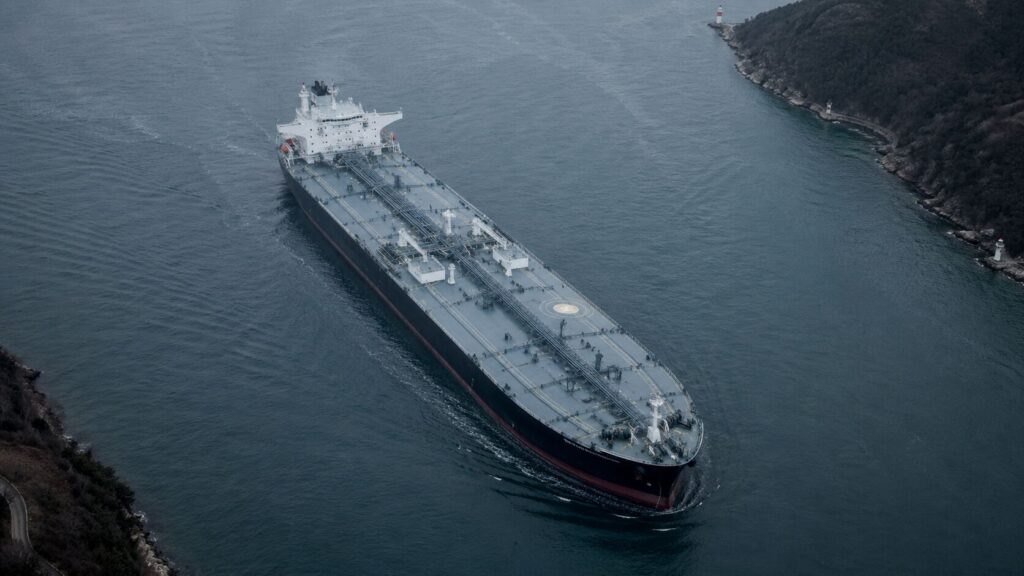
Oil hit $100 for the first time since early April. The UAE just quit OPEC. The Fed is trapped. Each development points to the same place — and gold is already there.
Oil Crashed 11%. Gold Went Up. That Tells You Everything.
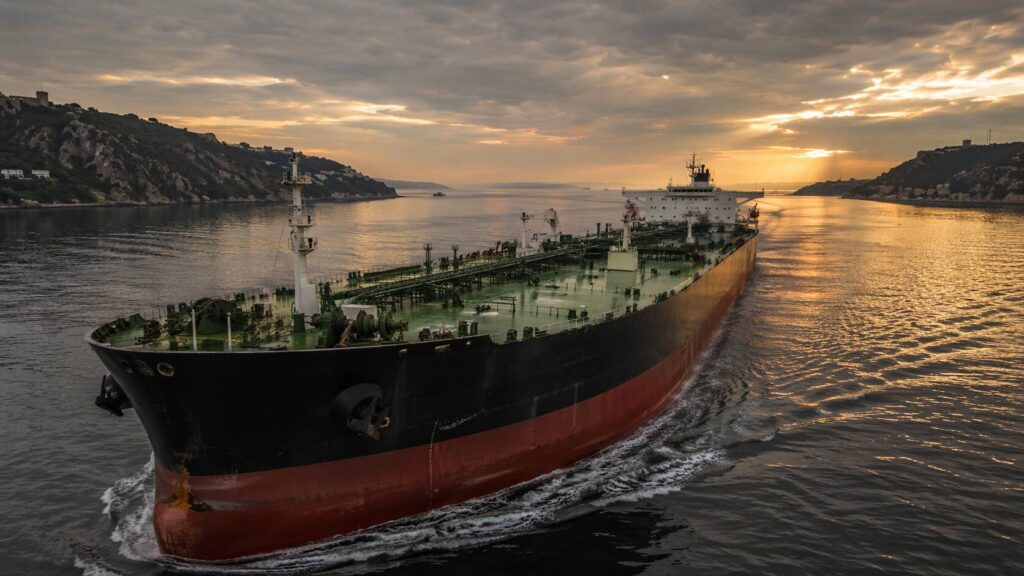
Oil crashed 11% on Friday when Iran reopened the Strait of Hormuz. Gold went up. That rare divergence — oil down, gold up, same catalyst — signals that gold’s rally is driven by monetary forces, not geopolitical ones. The war premium left oil. The monetary premium stayed in gold. Here is what that means for precious metals investors watching the Fed’s next move.
Hormuz Blockade Sent Gold Down 2%. Here’s Why That’s Bullish
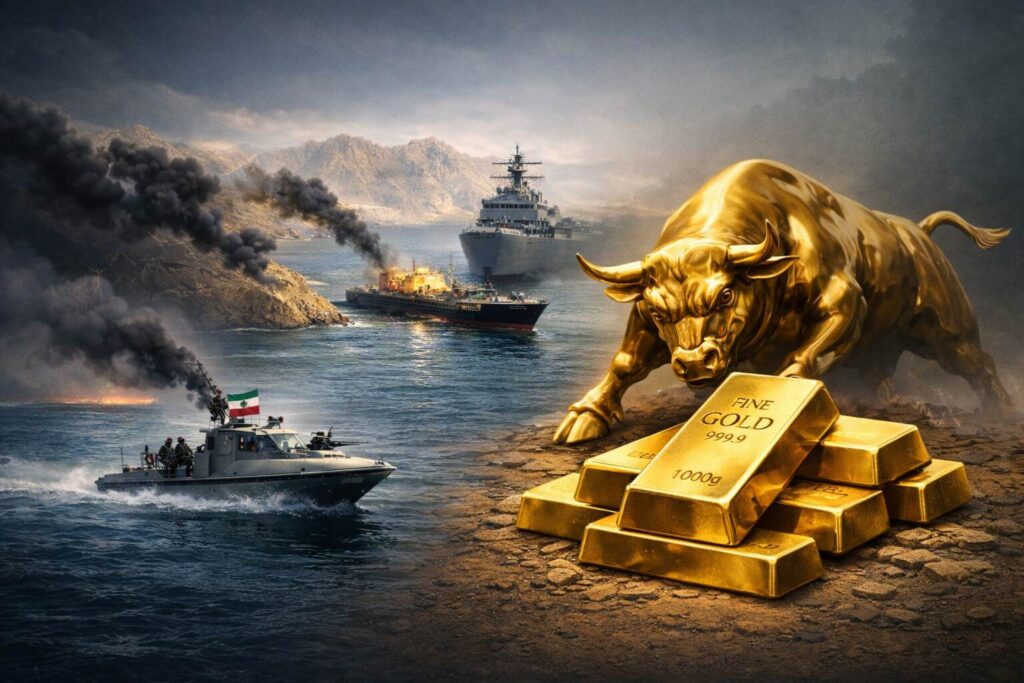
The Hormuz blockade sent gold down 2% as oil surged past $100. But margin liquidation — not fundamentals — drove the drop. With CPI at 3.3%, central banks buying, and the petrodollar requiring a navy to defend, the structural case for gold just got stronger.
Gold and Oil Brace for the Strait of Hormuz Deadline
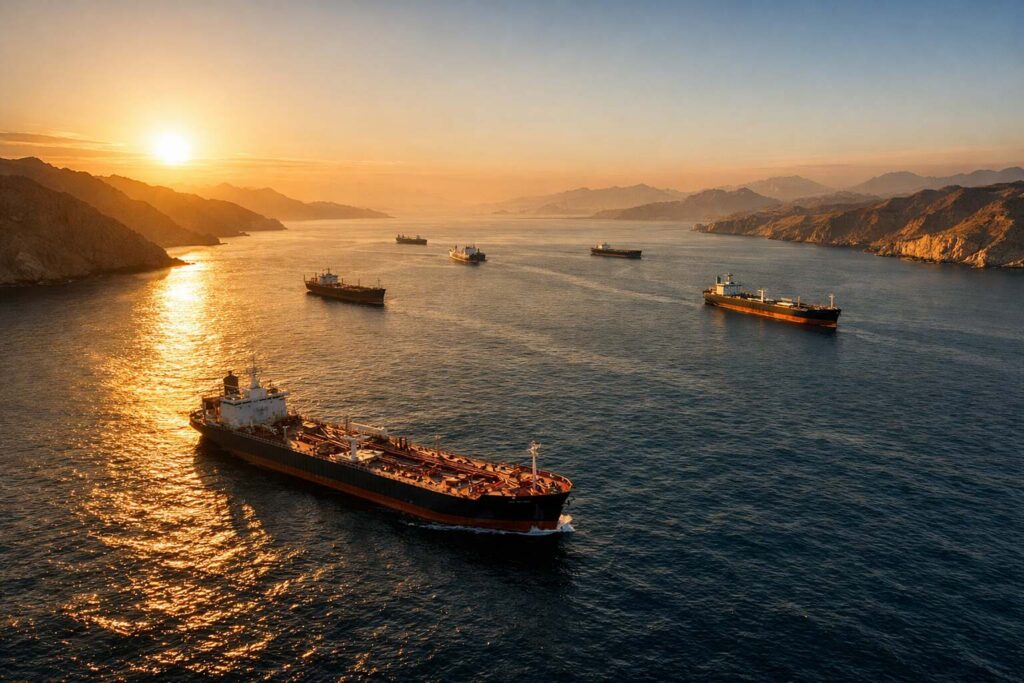
Tonight’s Strait of Hormuz deadline puts gold, oil, and markets at a crossroads. WTI is above $110, gold is holding near $4,665, and analysts say a ceasefire deal before 8 PM ET remains unlikely. Here’s what each outcome means for investors.


