 Silver Rises Over 120% YTD




Gold ETFs Just Pulled In $2 Billion. Silver Investors Pulled Out.

Gold ETFs pulled in nearly $2 billion this week even as gold’s price dipped, while silver’s biggest fund saw outflows. Here’s what that paper-positioning split does and doesn’t tell you.
Gold ETFs Lost 45 Tonnes Last Quarter. Central Banks Bought 289. Here’s What That Split Means.
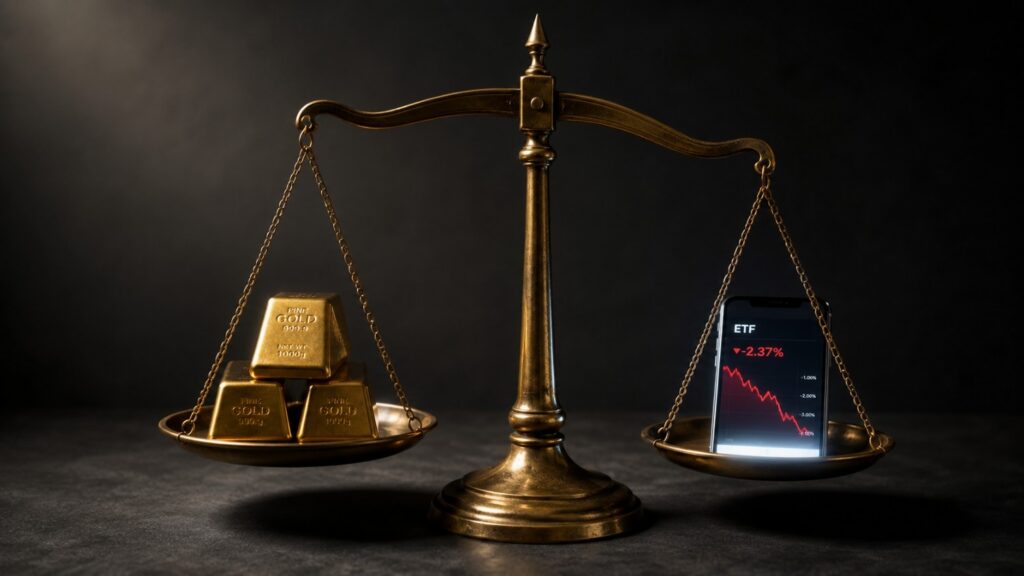
In Q2 2026, gold ETFs shed 45 tonnes. Central banks added 289 — more than six times as much. The World Gold Council data reveals what that split actually means.
Gold Is Closing Its Worst Quarter Since 2013. A War Made It Happen.
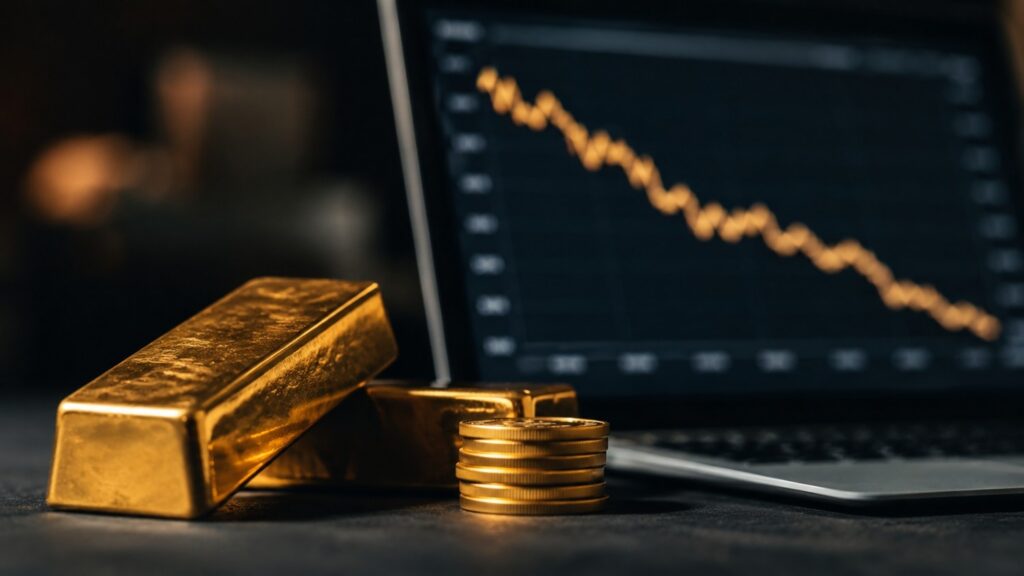
Gold entered Q2 at around $4,700. It is leaving at $4,015. That is the worst quarterly decline since the 2013 taper tantrum — and the cause is a war, not despite one.
PCE Hit 4.1%. Gold Went Up. Here’s Why.
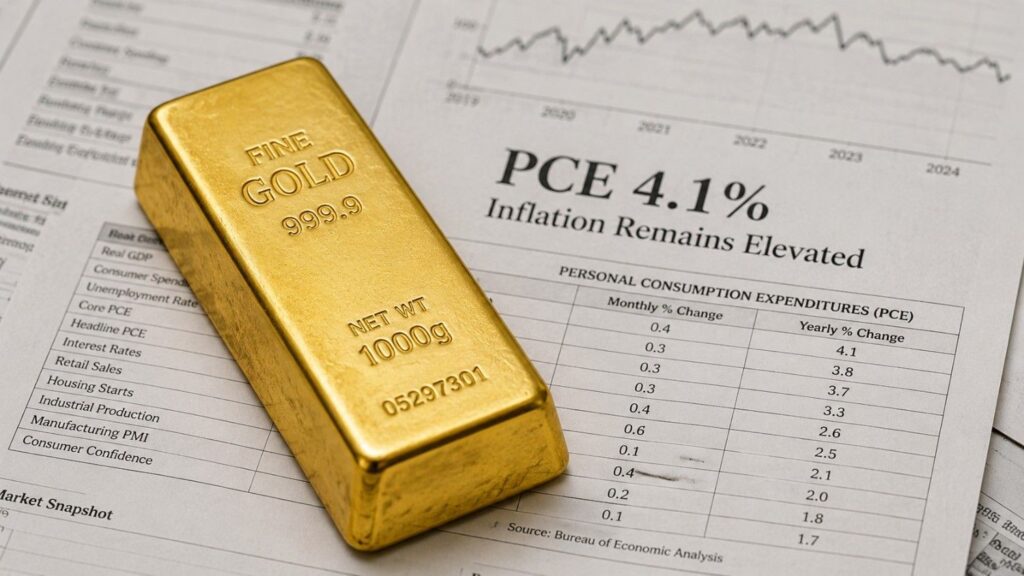
The government confirmed inflation hit a three-year high. Gold went up anyway. Here’s the mechanism most investors miss — and what it means if you hold physical gold.
298 Tonnes of ETF Gold Is Underwater. Central Banks Aren’t.
Approximately 298 tonnes of gold inside ETFs is currently held at a loss at current price levels — a structural ceiling on any near-term recovery. At the same time, the WGC’s 2026 survey found a record 45% of central banks plan to add to their reserves. Two markets. One metal. Very different time horizons.
How COMEX Sets Gold Prices and Moves the Market

COMEX gold prices drive the global market, but most investors don’t fully understand how. This guide explains how gold futures trading on COMEX sets the daily price of gold, why most contracts never result in physical delivery, and how “paper gold” can influence short-term volatility—even when physical demand remains strong.
Paper Gold vs Physical Gold: Which Is Safer?

When markets turn volatile, the difference between paper gold vs physical gold becomes critical. While ETFs, futures, and unallocated accounts offer convenient price exposure inside the financial system, physical gold provides direct ownership outside of it. Understanding counterparty risk, margin-driven volatility, and ownership structure helps investors choose the approach that aligns with long-term wealth preservation and portfolio protection goals.


