Are We Entering a “Super Capital Rotation”?

Analysts warn we may be entering a Super Capital Rotation — a massive shift of money from stocks into silver and gold. In a new discussion with Northstar Bad Charts, Alan Hibbard breaks down why silver could be the key trigger, the $55–$56 breakout zone to watch, and how this setup echoes the late 1960s before metals went parabolic.
Silver Squeeze 2025: The 45-Year Chart Pointing to Triple-Digit Prices
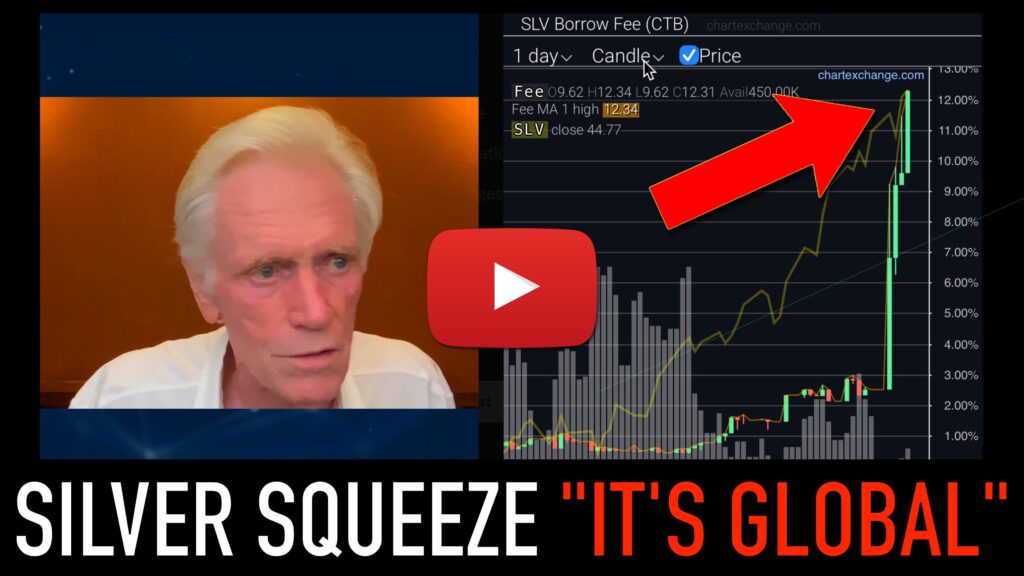
Mike Maloney believes we’re witnessing the most significant turning point in the silver market’s history — and his latest video, Understand the Silver Squeeze, reveals why. From London to Tokyo, silver lease rates are skyrocketing — now higher than platinum’s — as bullion banks struggle to find metal to lend. “Nobody’s got silver,” one market insider told Mike. “Lease rates are 20 to 30 percent if you’re lucky enough to find a lender.” That’s not normal. It’s a sign of deep, systemic stress. For the first time in decades, even the largest players are admitting that there’s “no free-floating silver […]
Triple-Digit Silver? Why the Charts Say It’s Possible

The silver market is flashing signals we haven’t seen in decades. In his latest video, Mike Maloney explains why silver’s chart pattern — the classic “cup and handle” — has broken out on major time frames, and why that could point to three-digit silver prices in the years ahead. Let’s unpack the key highlights from Mike’s update. The Cup-and-Handle Breakout On daily, weekly, and especially quarterly charts, silver has now completed a cup-and-handle pattern that technical analysts have been watching for years. Historically, this formation precedes major upside moves. Mike notes that silver hasn’t closed above $40 on a quarterly […]
Why Silver’s 32% YTD Rise Might Just Be the Beginning
Silver just hit $38 — its highest price in 14 years. What’s driving the rally, and why some analysts say much higher prices could be next.
