Gold Is Up 41% From a Year Ago. The Fed Can’t Stop It
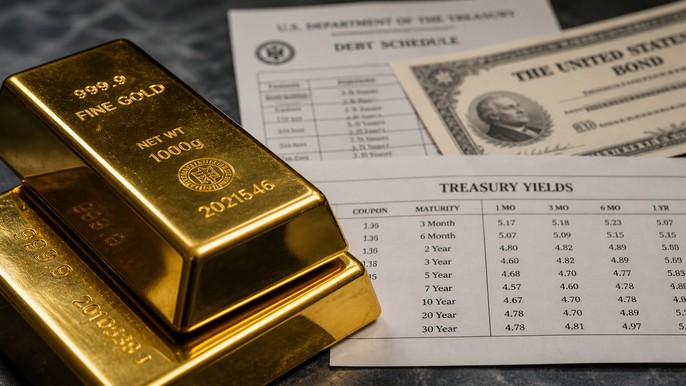
Gold is trading at $4,648/oz — up 41% from a year ago, down 14% from January’s record. Both numbers are true. The one that matters is the 41%. It held through a war, three hawkish Fed holds, and the most fractured FOMC vote since 1992. Here’s why that gap between the record and today’s price is a floor, not a warning.
What the Gold Price Per Ounce Really Tells You

Most investors glance at the gold price per ounce and move on. But this single number reveals more about the health of the monetary system than almost any other metric — here’s how to read it.
5 Economic Warning Signs Gold Investors Need to See Today

GDP is up. So is inflation. Savings are down. Real incomes are falling. Here are five economic data points released today that every gold investor needs to understand — and what each one means for the case for physical gold.
The Gold Inflation Paradox Most Investors Miss
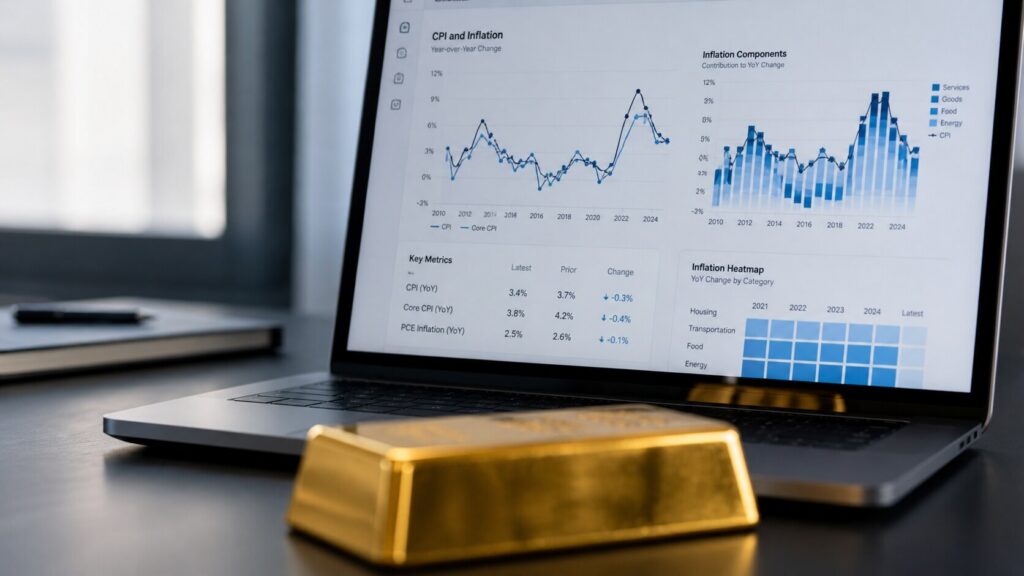
Gold fell around 15% from its all-time high while inflation hit a nearly 3-year peak. The inflation-hedge narrative isn’t wrong — it’s incomplete. Here’s what the data really shows about gold and rising prices.
WGC Q1 2026: What Asia Knows That Wall Street Doesn’t
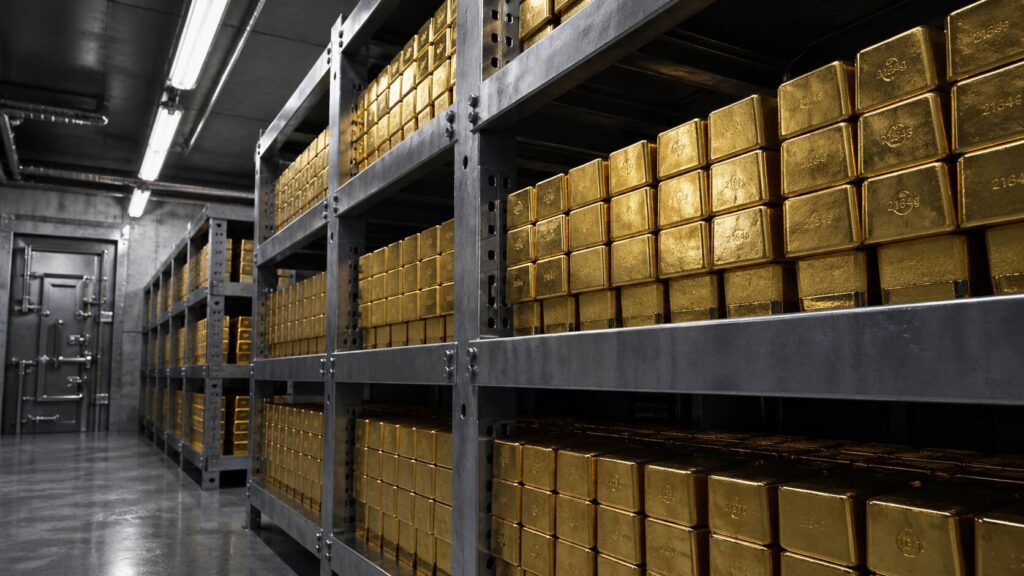
Asian investors drove physical gold bar demand to an all-time quarterly record in Q1 2026 — while Western ETF holders sold. The WGC’s latest demand report shows which side of that trade is thinking in decades, not quarters.
