Published: 05-01-2026, 04:03 pm | Updated: 05-01-2026, 04:08 pm
The gold price per ounce is one number that most investors check and few truly understand. Rather than a simple commodity price, it reflects real-time confidence in currencies, central bank credibility, and the health of the monetary system. When gold rises persistently, it is telling you that purchasing power is being eroded somewhere in the system. In short, learning to read this number is one of the most useful things a long-term investor can do.
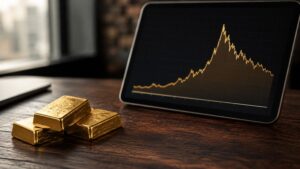
As of early May 2026, gold is trading at around $4,600 per ounce — down roughly 17–18% from its all-time high of approximately $5,589–$5,595, set on January 28–29, 2026. Despite that pullback, it remains up approximately 75% from where it started 2025 at $2,624 per ounce [Trading Economics]. That number is not just a price. It is a verdict on the monetary system — and right now, the verdict is unambiguous.
What Is the Gold Price Per Ounce — and How Is It Set?
The gold price per ounce is the spot price of one troy ounce of pure gold. It is the standard unit the entire global market runs on — from bars and coins to ETFs and futures contracts. Importantly, a troy ounce is not the same as a standard ounce. One troy ounce equals 31.103 grams, while a standard avoirdupois ounce is roughly 28.35 grams.
The spot price is set continuously across major exchanges: the London Bullion Market Association (LBMA), the COMEX in New York, and the Shanghai Gold Exchange. As a result, it updates by the second during market hours. The LBMA also publishes its official benchmark twice daily — the AM fix and PM fix — which institutional buyers, miners, and central banks use to settle large transactions [World Gold Council].
When you buy physical gold from a dealer, you pay spot plus a premium. That markup covers manufacturing, distribution, and margin. In other words, spot is the baseline price of the metal, and the premium is the cost of ownership.

Your Gold Buying Guide Most investors overpay when they buy gold. Then overpay again when they sell. This guide shows you exactly what to own — and why.
What Does the Gold Price Per Ounce Actually Tell You?
Most investors see the gold price per ounce as a supply-and-demand reading for a metal. That is true as far as it goes — which is not very far.
Gold is denominated in U.S. dollars. Therefore, the gold price per ounce is always, simultaneously, a statement about the dollar. When the dollar weakens, it takes more dollars to buy the same amount of gold. As a result, the price in USD rises even if gold itself has not changed. This inverse relationship is one of the most reliable in financial markets.
However, the longer view is starker. Gold has no yield, no dividend, and no earnings. The only reason its price rises over decades is that the currencies measuring it lose purchasing power. In 1971, for example, Nixon ended the gold standard at the fixed rate of $35 per ounce. Today, by contrast, a dollar buys about 1/4,600th of an ounce [Federal Reserve Bank of St. Louis]. The gold price per ounce has not gone up because gold got better. The dollar got worse.
What’s Behind the 2025–2026 Price Surge?
Gold did not drift higher over recent years — it broke out. Specifically, the metal set 53 new all-time highs throughout 2025, climbing from $2,624 to above $4,300 by year-end. It then surged further to its all-time peak in January 2026.
Several structural forces converged at once. First, central banks bought 863 tonnes of gold in 2025 — well above the 2010–2021 average of 473 tonnes annually. These are sovereign institutions making strategic, multi-decade reserve decisions, shifting capital toward an asset with no counterparty risk [World Gold Council, Gold Demand Trends: Full Year 2025].
Second, total global gold demand surpassed 5,000 tonnes for the first time in recorded history, generating $555 billion in market value — 45% above the prior year. Additionally, gold ETF assets under management doubled to $559 billion, with physical holdings hitting a record 4,025 tonnes [World Gold Council, Gold Demand Trends: Full Year 2025].
That is not noise. That is a structural shift in how the world allocates capital.
What Actually Moves the Gold Price?
There are four primary drivers. Each one is worth understanding in its own right.
Real interest rates. This is the most direct lever. When inflation-adjusted rates are low or negative, holding gold costs nothing in foregone yield — and it becomes competitive with bonds. When real rates rise, however, gold faces headwinds. This explains much of its weakness in 2022, and equally, its recovery from 2024 onward as real rates began declining.
Dollar strength. A weaker dollar mechanically lifts the USD price of gold. It is arithmetic, not sentiment. Consequently, dollar weakness through 2025 and into 2026 has been one of gold’s most consistent tailwinds.
Geopolitical stress. Uncertainty pushes capital toward assets outside the financial system. For instance, escalating Middle East tensions through late 2025 and into 2026 sent gold above $5,000 for the first time, as investors sought a store of value with no counterparty exposure.
Monetary debasement. Persistent deficits and expanding central bank balance sheets erode the purchasing power of fiat currencies over time. Gold does not eliminate that risk. Instead, it relocates it — out of paper and into metal.
All four drivers are active right now. Goldman Sachs raised its year-end 2026 gold target to $5,400 per ounce in January 2026 and held that call through March’s sell-off. Meanwhile, J.P. Morgan went further in February 2026, targeting $6,300 by year-end — with an upside scenario of $8,000–$8,500 if private investor allocations increase meaningfully [Reuters; TheStreet].
So What Should You Actually Do With This Information?
The daily price movement is the least informative thing this metric has to offer. Instead, the signal is in the multi-year trend and what is driving it.
Don’t anchor to yesterday’s price. The question is not whether gold looks expensive versus last year. Rather, it is whether the forces driving it — debasement, geopolitical stress, sovereign debt concerns — are intensifying or fading. Right now, they are intensifying.
Look at it across currencies. Gold has hit all-time highs in euros, yen, sterling, and Canadian dollars — not just USD. When an asset hits records globally, it is not the asset that is moving. The currencies are.
Treat pullbacks as information, not alarm. Gold’s current 17–18% retreat from its January 2026 peak is well within historical norms. During the 2001–2011 bull run, for example, gold suffered corrections of 15–30% multiple times — including a 34% drop in 2008 — before ultimately rising more than 650% trough to peak [CNBC]. Corrections clear out weak hands. They do not end bull markets.
Use the price as a signal, not a scoreboard. A rising gold price over years is one of the clearest indicators that purchasing power protection belongs in your allocation. Physical gold — coins or bars, held directly or in allocated storage — gives you that exposure with no counterparty risk. A gold ETF tracks the price but remains inside the financial system. In a genuine crisis, therefore, that distinction matters.
Stay On Top of Gold & Silver Prices
Get important market alerts sent straight to your inbox.
People Also Ask
What is the gold price per ounce today?
As of early May 2026, the gold spot price is approximately $4,600 per ounce. Prices update in real time across COMEX and the LBMA. For a live reading, GoldSilver.com’s spot price tracker runs continuously during market hours.
Why did the gold price per ounce hit an all-time high in January 2026?
Gold peaked at approximately $5,589–$5,595 per ounce on January 28–29, 2026. The move was driven by escalating U.S.-Iran tensions, a weakening dollar, record central bank buying, and persistent inflation concerns. It was, in short, the culmination of a structural bull market — not a single catalyst.
What does a rising gold price per ounce mean for the economy?
A sustained rise typically signals declining confidence in fiat currencies, rising inflation expectations, or growing geopolitical uncertainty. In other words, it is less a statement about gold and more a statement about the paper currencies being used to measure it.
What is a troy ounce and why is gold priced in it?
A troy ounce equals 31.103 grams — heavier than a standard (avoirdupois) ounce of 28.35 grams. The troy system has been the global standard for precious metals since the Middle Ages. As a result, all spot prices, futures contracts, and bar weights use it.
What is the difference between spot price and the price I pay at a dealer?
Spot is the raw market price for one troy ounce of pure gold for immediate delivery. Dealers then add a premium on top — covering minting, distribution, insurance, and margin. Coins typically carry higher premiums than bars, due to their collectability and liquidity.
The Number Is Telling You Something — Are You Listening?
Most investors spend their time watching gold’s price without stopping to ask what it is saying. At $4,600 per ounce — still roughly 75% above where it started 2025 — this is not a speculative signal. Rather, it is a structural one: a slow, persistent loss of confidence in paper money, sovereign debt, and the institutions behind them.
That story does not shift on a Tuesday because of a Fed statement. Instead, it shifts when the underlying dynamics — debt, debasement, geopolitical fragmentation — reverse. Right now, none of those are reversing.
The investors who do well with gold are not the ones who time entries perfectly. They are the ones who understand what they own and why they own it. If you are working on that understanding, GoldSilver.com is a good place to keep going.
SOURCES
1. Trading Economics — Gold Price Chart & Historical Data
2. World Gold Council — Gold Spot Prices & Market History
3. Federal Reserve Bank of St. Louis (FRED) — Consumer Price Index, All Urban Consumers
4. World Gold Council — Gold Demand Trends: Full Year 2025
5. World Gold Council — Central Banks: Gold Demand Trends Full Year 2025
6. Reuters — J.P. Morgan Expects Gold Prices to Reach $6,300/oz by End of 2026
7. TheStreet — Goldman Sachs Has Blunt Message on Gold Price for Rest of 2026
8. CNBC — What Gold’s Past Bull Runs Tell Us About Where Price Could Go Next
Disclaimer: This article is for informational and educational purposes only. It does not constitute investment advice. Please consult a qualified financial adviser before making any investment decisions.
You may also like:
- The Gold Inflation Paradox Most Investors Miss
- Insurance vs. Upside: Balancing Your Portfolio with Gold and Silver
- Gold Bullion vs. Jewelry: Why Serious Investors Choose the Bar
- Gold & Silver IRA: Why Starting Early Costs You Less
- Silver Fair Value: What the Data and History Show
- Gold or Silver Price Dip: Temporary Correction or Trend Reversal?
- What Switzerland’s Gold Freeze Means for Investors
- What History Shows About Buying Gold After a Pullback