Published: 05-18-2026, 09:43 am | Updated: 05-18-2026, 01:49 pm
Key Takeaways
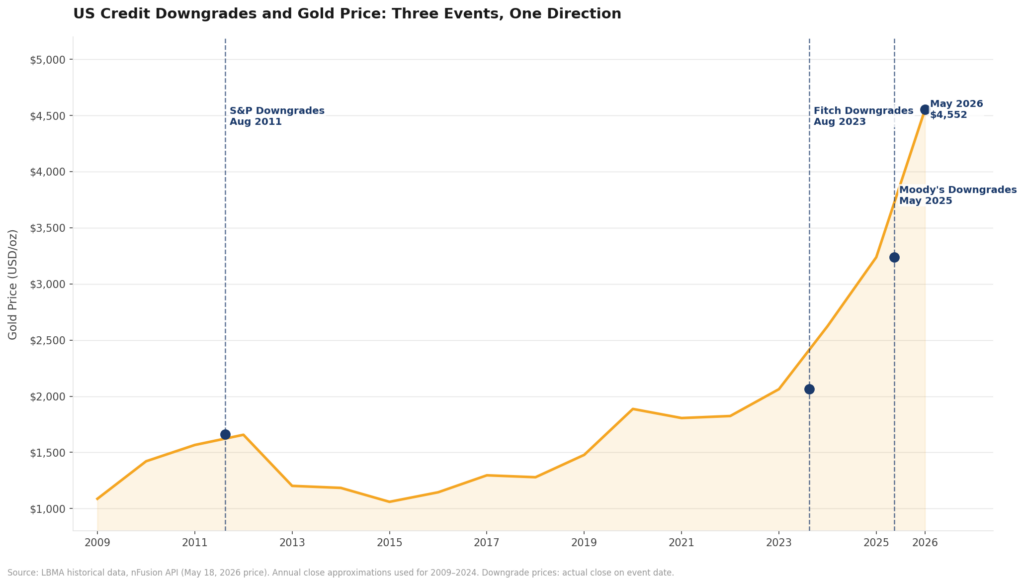
- On May 16, 2025, Moody’s downgraded the US from Aaa to Aa1 — making it the last major rating agency to remove the US from the top credit tier, completing a process S&P started in 2011
- Gold closed at $3,237 on the day of the downgrade. It trades above $4,550 today — a gain of more than 40% in twelve months, according to LBMA spot pricing
- Physical gold is the only major asset with zero counterparty risk — it cannot be downgraded because no government or institution stands behind it, and central banks have been buying it for 17+ consecutive months for exactly this reason
About one year ago, one number changed — and the financial world’s last illusion about US government debt disappeared with it.
On May 16, 2025, Moody’s downgraded the United States from Aaa to Aa1, completing what S&P started in 2011 and Fitch continued in 2023. For the first time in history, no major rating agency considers US Treasuries the world’s safest investment. Gold closed that day at $3,237 per ounce, according to LBMA spot data.
It trades around $4,550 today. That’s not a coincidence. It’s a confirmation.
Why Did Moody’s Downgrade the US?
The reasoning came down to two things: the debt load and the interest bill. US federal debt now exceeds $36.8 trillion, according to US Treasury data. According to the Congressional Budget Office, net interest payments crossed $1 trillion in FY2026. That surpassed the entire US defense budget ($947B) for the first time.
Notably, this wasn’t a surprise. The surprise was that it took this long.
S&P made this call in August 2011, when debt stood at $14 trillion. Fitch followed in August 2023. Moody’s held out, citing the dollar’s reserve currency status and the depth of Treasury markets. What changed? The math overwhelmed the narrative. When your interest bill exceeds your defense budget — and grows faster than the economy — no rating model can justify a top score.

The Edge Every Investor Needs Smarter precious metals investing starts here. The Nuggets Newsletter brings you essential market insights, Fed updates, global trends, educational videos, and much more.
What Does a US Credit Downgrade Mean for Gold Prices?
Most coverage focuses on the US government’s reputation. That, however, is the wrong frame.
A US credit downgrade changes what “safe” means for every investor. For decades, US Treasuries carried one assumption: risk-free. Insurance companies, pension funds, and individual savers built entire portfolios around it. The “risk-free rate” is the anchor everything else is priced against. Remove it, and every holder of that paper must reassess their risk model from the ground up.
So what fills the gap? Gold’s answer is 5,000 years old: no counterparty, no issuer, no printing press. A Treasury bond is a liability of the US government. Gold, by contrast, is a liability of no one. It cannot be downgraded because there is no institution standing behind it to downgrade.
What Has Gold Done in the 12 Months Since the Downgrade?
History offered a useful parallel, though not in the way most people expected.
When S&P downgraded the US on August 5, 2011, gold spiked to a then-all-time high of $1,917 by September 6, per LBMA records. That was a 15% move from roughly $1,660 in four weeks — fast and violent, not a gradual drift.
The response to the Moody’s downgrade was different. Gold closed at $3,237 on May 16, 2025 — no panic spike. Instead, it rose steadily. By January 2026, gold had climbed to an all-time high of $5,589 per ounce, according to USAGOLD market data — a 73% gain from the downgrade close in eight months. It has since pulled back to around $4,550, roughly 19% below that peak, as inflation data strengthened expectations for tighter monetary policy. Nevertheless, the 12-month return from the downgrade date stands at more than 40%, according to LBMA spot pricing.
The pattern is consistent with prior downgrade cycles: the market doesn’t react with a single spike. It reprices structurally, over months, as institutional frameworks update to match the new reality.
Is the Structural Case for Gold Still Intact?
Ratings agencies don’t move capital. They confirm what capital is already doing.
According to World Gold Council data, central banks have been net gold buyers for 17+ consecutive months. They didn’t wait for Moody’s. Their own risk models got there first. The downgrade was, therefore, the establishment catching up to the buyers.
Some institutional mandates require holdings in AAA-rated sovereign debt. That designation is now gone from all US government securities, and compliance requires those mandates be reviewed.
Most capital stays in Treasuries — the market is too large and liquid to abandon. But at the margin, some will look for an alternative. There is only one asset class with no issuer, no maturity date, and no rating to lose.
How Should Individual Investors React to This Downgrade?
Not with panic. With perspective.
The case for gold was never “the dollar collapses tomorrow” — a framing GoldSilver has consistently rejected. It was always simpler: the US fiscal trajectory was unsustainable. When that reality became undeniable, capital would migrate toward assets with no sovereign credit risk.
That migration is now underway. It is not driven by retail fear. Instead, it is led by the central banks of Poland, India, Turkey, and China — institutions that move slowly and deliberately, buying steadily for 17 consecutive months. The pullback from $5,589 to $4,551 has, consequently, returned gold to a level that reflects the structural case without the momentum premium.
One year ago, Moody’s confirmed what the math had been saying for 15 years. The market heard it. Gold prices rose more than 40% in the twelve months that followed.
Stay On Top of Gold & Silver Prices
Get important market alerts sent straight to your inbox.
SOURCES
1. Moody’s Ratings — US Sovereign Downgrade Announcement
2. US Treasury Fiscal Data — Debt to the Penny
3. Congressional Budget Office — Budget and Economic Outlook: 2026 to 2036
4. LBMA (London Bullion Market Association) — Gold Price Data
5. World Gold Council — Gold Demand Trends: Full Year 2025
6. GoldPrice.org — Gold Price on May 16, 2025
7. USAGOLD — Daily Gold Price History, January 2026 All-Time High
You May Also Like:
- No Deal, No Premium: Why Silver Fell 7% at the Trump-Xi Summit
- Gold Fell. China Bought Its Most in 17 Months. Here’s Why.
- Why Silver Falls Harder Than Gold — And What It Means
- Gold Near $4,700: The Chaos Isn’t a Ceiling. It’s a Floor
- 5 Forces Shaping Gold and Silver at the Beijing Summit
- The Real Reason Gold Falls When Inflation Surges
- CPI Hits 3.8%. Gold Falls. The Mechanism Nobody Explains
- Why the Gold Silver Ratio Is Falling — and What It Means