Silver Rises Over 120% YTD




Published: 08-05-2026, 09:43 am
Both metals crossed levels they had not touched since early July. This is not a coincidence. However, understanding why they moved, and why silver moved more, matters more than the numbers themselves.
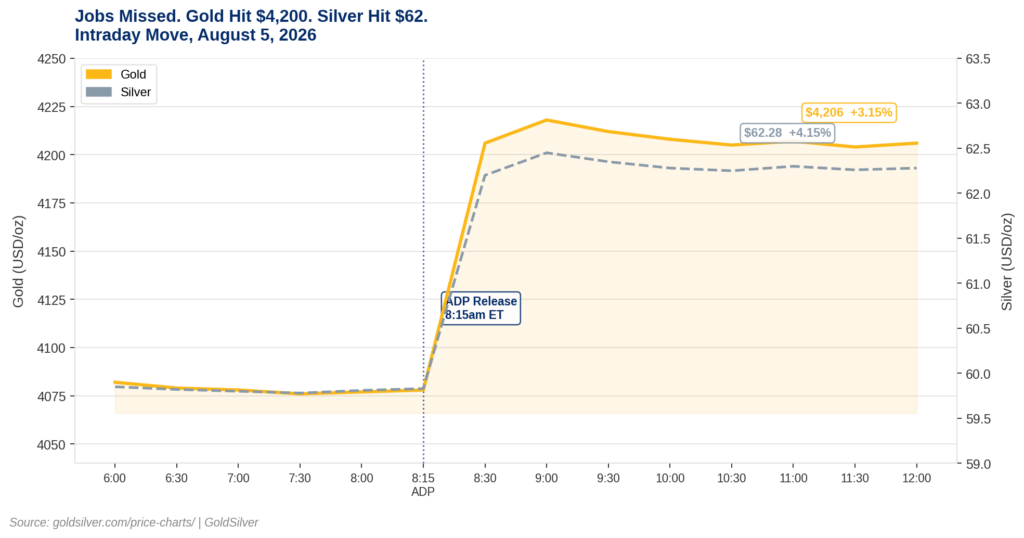
Gold is trading at $4,206 an ounce, up 3.15% from the Wednesday open of $4,077. Silver is at $62.28 an ounce, up 4.15% from its open of $59.81. Three specific forces drove this move simultaneously, and each one connects to the same transmission channel.
Why Did Gold and Silver Surge on August 5, 2026?
Force 1: The July ADP report shifted rate expectations. The ADP National Employment Report for July, released at 8:15 a.m. ET, showed private-sector hiring added just 44,000 jobs, well below the Dow Jones consensus forecast of 75,000 and below a downwardly revised 95,000 in June. The miss landed on a labor market already showing five consecutive weeks of deceleration in ADP weekly pulse data through mid-July. As a result, traders on CME FedWatch trimmed the implied probability of a September 15–16 Fed rate hike, which had been running above 60% ahead of the report.
Force 2: Lower hike odds compress expected real yields. This is the exact mechanism connecting the jobs number to gold. Gold is negatively correlated with real yields, which equal the nominal 10-year Treasury yield minus 10-year breakeven inflation expectations. When markets price out a Fed hike, they pull the expected path of nominal yields lower. Consequently, even if breakeven inflation holds flat, real yields fall. That compression is what drives gold higher. The ADP data did not just “help gold.” Specifically, it altered the real-yield math, and real yields are the single most important macro variable in gold’s pricing equation.
Force 3: Hormuz deal optimism softened the inflation outlook. US Treasury Secretary Bessent signaled Tuesday that a Hormuz deal was close. Qatar confirmed negotiations. Iran, notably, denied direct talks with Washington. That denial is worth tracking, given that prior optimism on this front faded when Iran’s position hardened. Nevertheless, Brent crude fell more than 2% Wednesday morning. Lower oil weakens the inflation case for hiking. Furthermore, that softer inflation outlook again feeds the same real-yield channel.

The Edge Every Investor Needs Smarter precious metals investing starts here. The Nuggets Newsletter brings you essential market insights, Fed updates, global trends, educational videos, and much more.
Why Is Silver Outperforming Gold Today?
Silver’s extra percentage point of gain is not noise. It is signal.
Silver carries two drivers that gold does not. First, it responds to the identical real-yield and dollar mechanics. Second, approximately 58% of silver’s annual demand comes from industrial applications, according to the World Silver Survey 2026. When a soft jobs report signals the economy is cooling but not collapsing, it sends a “Goldilocks” read to industrial-demand-sensitive metals: the Fed will not hike aggressively, yet manufacturing demand stays intact. Therefore, silver absorbs the same macro tailwind with built-in leverage.
The gold-silver ratio fell to approximately 67.5 from roughly 68 last week. For context, the 50-year historical average sits near 65, meaning silver remains structurally undervalued relative to gold. When silver outperforms on a day gold itself is rallying, the ratio move is especially constructive for long-term holders of both metals.
What Does This Mean for the Structural Case?
Gold hit an all-time high of $5,589 per ounce on January 28, 2026. The subsequent correction of roughly 25% was mechanically driven: the US-Iran conflict sent oil sharply higher, which raised inflation expectations, which pushed the Fed toward a hawkish posture, which lifted real yields, which capped gold.
Today’s move reflects partial unwinding of that dynamic. Moreover, the structural demand floor has not moved. Central banks purchased 288.9 tonnes of gold in Q2 2026, a quarterly record up 62% year-over-year, per the World Gold Council’s Gold Demand Trends Q2 2026. That buying continued throughout the correction. In other words, the price fell while the floor rose.
What Should You Watch Before Friday?
Friday’s BLS Nonfarm Payrolls report is the real tiebreaker. ADP provides directional guidance rather than precision: June’s ADP print was revised down to 95,000 in today’s report, and the official BLS count for June came in at just 57,000. A similarly soft July NFP would push September hike odds materially lower and likely carry gold higher. A strong number would revive the hawkish case and pressure both metals.
In addition, Wednesday’s ISM Services PMI for July landed at 10 a.m. ET. Watch the prices-paid subindex specifically, as Warsh has consistently cited it as his primary inflation concern.
Also monitor Iran’s posture carefully. The Hormuz deal progress is real, but Iran’s denial of direct US talks is a standing caveat. See our jobs-week setup piece for the full framework on how each release moves the September probability. For long-term holders of physical gold and silver, the mechanism that drove the correction is unwinding. Nevertheless, Wednesday’s move is the clearest signal since early August that the path of least resistance is higher.
Stay On Top of Gold & Silver Prices
Get important market alerts sent straight to your inbox.
SOURCES
1. GoldSilver.com price charts, gold $4,206.35 and silver $62.284, as of August 5, 2026 (8:30 a.m. ET): goldsilver.com/price-charts/
2. CME Group FedWatch Tool — September 2026 FOMC rate-hike probability: cmegroup.com/markets/interest-rates/cme-fedwatch-tool.html
3. ADP Research Institute — July 2026 National Employment Report (44,000 private-sector jobs; June revised to 95,000), released August 5, 2026: adpemploymentreport.com
4. CNBC — “Gold extends gains on lower oil and softer dollar, markets await US jobs data,” August 5, 2026: cnbc.com
5. World Gold Council — Gold Demand Trends Q2 2026 (288.9 tonnes central bank purchases, +62% YoY), published July 30, 2026: gold.org
6. Silver Institute — World Silver Survey 2026 (industrial demand ~58% of total): silverinstitute.org
7. Federal Reserve — FOMC Statement July 29, 2026 (rates unchanged, 9-3 vote, Warsh withheld dot): federalreserve.gov
8. Institute for Supply Management — July 2026 Manufacturing PMI Report (55.6%), August 3, 2026: ismworld.org
Disclaimer: This article is for informational purposes only and does not constitute investment advice. Past performance is not indicative of future results. Always consult a qualified financial advisor before making investment decisions.
You May Also Like:
- South Korea’s Central Bank Hasn’t Bought Gold in 13 Years. That Just Changed.
- Gold and Silver Hold As Bessent Promises a Hormuz Deal, a Vessel Gets Hit, and JOLTS Drops
- Why Gold Is Holding Near $4,067 Ahead of a Jobs Week That Could Trigger a Rate Hike
- Manufacturing Hit a Four-Year High Today. Gold Didn’t Move. Here’s Why That’s the Story.
- Gold Is Caught Between a Structural Bull Case and a Policy Ceiling. Something Has to Give by Thursday.
- The Same Force That Crushed Gold All Year Just Flipped
- Gold ETFs Lost 45 Tonnes Last Quarter. Central Banks Bought 289. Here’s What That Split Means.