Silver Rises Over 120% YTD




Published: 08-31-2026, 03:55 pm
You’ve probably seen the headlines. The national debt is spiraling. The AI trade is a bubble waiting to pop. Foreclosures are back. Private credit is hiding the next 2008. Four separate arguments, all running at once, all sounding plausible.
So we did what actually settles an argument like this. We went to the primary data behind each one, one at a time.
Is the National Debt Actually a Ticking Time Bomb?
Start with the number everyone throws around: the national debt. Here’s the part that’s genuinely new. Interest costs relative to the size of the economy are now higher than at any point since 1940. That’s the earliest year this data exists. According to the Congressional Budget Office, interest payments are on track to hit $1 trillion in 2026. That’s 3.3% of GDP. It beats the previous high set back in 1991. It’s also 18.6% of federal revenue, another record.
Here’s the mechanism-level detail that gets lost in the panic: this didn’t happen overnight. It built up over decades. Multiple administrations, multiple Fed chairs, multiple market cycles all played a role. Slow-moving problems tend to have more off-ramps than sudden ones. Productivity gains, a resilient labor market, and deep US capital markets give policymakers room. Few other countries have that same room.
None of that makes rising interest costs a non-issue. It’s a serious structural challenge. Interest payments have now grown large enough to exceed what the federal government spends on national defense. But “serious” and “sudden collapse” are different claims. The data only supports the first one.
Here’s where gold enters the picture, and it’s not the reason you’d expect. Central banks have bought roughly 1,000 tonnes of gold a year on average over the past four years, according to the World Gold Council. They are not buying because they think the sky is falling. They’re buying because gold is the one major reserve asset that isn’t also someone else’s liability. A government’s own IOUs make up a large share of its reserves. As that government’s interest burden keeps climbing, an asset with no counterparty starts looking structurally different than it used to.
The Knowledge That Changes Everything

Two essential guides — yours free. Understand why gold matters and why fiat currencies always fail.
Is the AI Trade Really a Bubble Waiting to Burst?
This is the argument that deserves the most nuance, because “bubble” gets thrown around without much precision.
Start with the comparison everyone reaches for: the dot-com era. At the 2000 peak, the top 10 stocks in the S&P 500 made up about 26.6% of the index. Today, per J.P. Morgan Asset Management, that concentration figure sits at 40.8%, well above the dot-com peak.
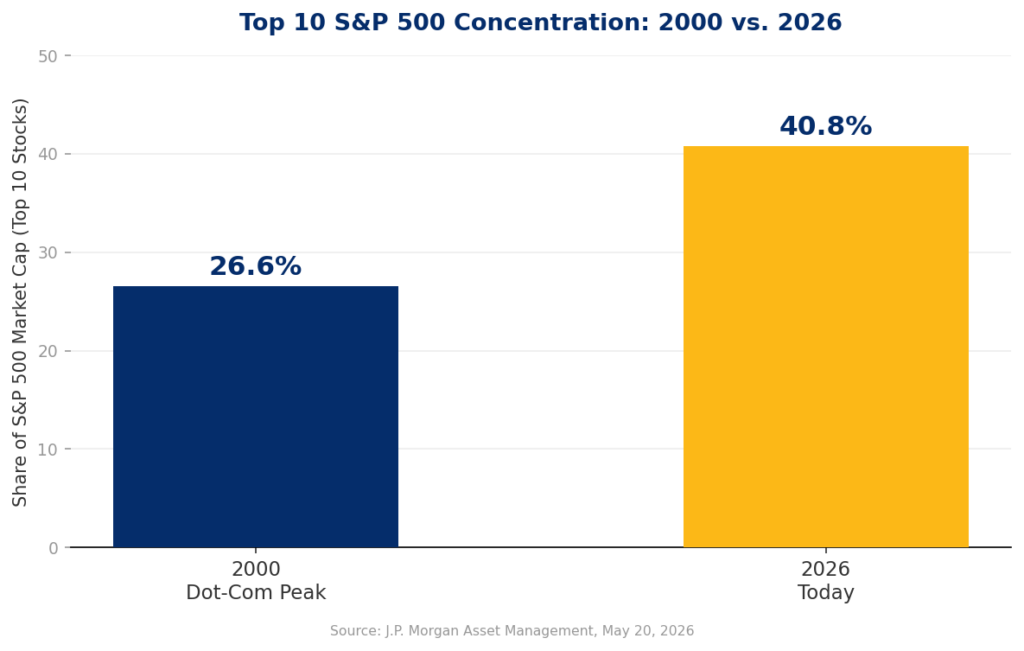
That’s the scary number. Here’s the mechanism most doom threads skip, and it’s the reason the two eras may not behave the same way.
Global AI spending is projected to exceed $2.5 trillion this year, according to Gartner. Separately, Goldman Sachs and JPMorgan have both pointed out something important about how that spending is being funded. Specifically, the biggest spenders, Microsoft, Alphabet, Meta, and Amazon, are funding their data center buildout largely through operating cash flow. They’re not relying on debt or dilutive equity raises. The dot-com bust, by contrast, was in large part a debt and cash-burn story. That difference matters. It doesn’t mean today’s valuations can’t or won’t correct. But the mechanics of a correction could look different this time. The companies at the center of it are self-funding with real profits, not borrowed money.
Gold’s role here has nothing to do with whether AI is a bubble. When more than 40% of the market’s value sits in just 10 names, a single earnings miss can move the whole index. Gold doesn’t care about any single company’s quarter. That’s a mechanical fact about concentration risk, not a market-timing call. It’s why gold has functioned as a counterweight to concentrated markets for centuries.
Are We Actually Heading for a New Foreclosure Crisis?
Foreclosures are the argument most likely to trigger 2008 flashbacks, understandably. ATTOM’s Mid-Year 2026 U.S. Foreclosure Market Report, published July 16, 2026, found 227,548 properties with foreclosure filings in the first half of the year. That’s up 21% from the same period a year earlier.
That’s a real number, and it’s genuinely higher. Here’s the context that changes what it means. Pandemic-era forbearance programs artificially suppressed foreclosure activity for years. What’s happening now is largely that backlog finally working through the system. ATTOM’s own CEO, Rob Barber, put it this way in the same July 16, 2026 report: activity is “gradually returning to more typical patterns.”
The states with the highest foreclosure rates in the first half of 2026, per ATTOM’s own state-by-state data, were Florida, South Carolina, Indiana, Delaware, and Illinois. That’s a real, specific pocket of stress worth watching. It is not the same as a national wave.
Most analysts still call a broad 2026 housing crash unlikely. There’s a structural reason: homeowners are sitting on record built-up equity, and supply remains structurally low. That’s close to the opposite of the oversupplied, underwater-mortgage environment that defined 2008.
So where does gold fit into a housing story? Real estate has always competed with gold as a store of household wealth. When housing affordability gets stretched, gold offers something a house structurally can’t: liquidity. You can sell an ounce of gold in minutes, not months. That’s exactly why it complements property rather than competing with it.
Is Private Credit Quietly Becoming the Next 2008?
This is the argument that deserves more attention than it usually gets, precisely because it’s less visible than public markets.
Private credit is a roughly $1.8 to $2 trillion industry of non-bank corporate lending. It expanded rapidly as banks pulled back from riskier loans over the past decade. Here are the numbers worth sitting with. Fitch Ratings’ portfolio of privately monitored borrowers hit a record 9.2% default rate in 2025, up from 8.1% in 2024. Separately, Fitch’s broader trailing-12-month private credit default measure climbed past 6% by the spring, then hit a fresh record of roughly 6.1% by July 2026. JPMorgan Chase CEO Jamie Dimon used his 2026 shareholder letter to warn that private credit losses will likely run higher than expected. He pointed directly to the industry’s aggressive, self-reported valuations.
There’s a specific mechanism that makes this hard to see coming, and it’s genuinely worth understanding on its own. We’re not going to walk through exactly how it works here. It’s one of two things this article is leaving for the video to unpack in full. What we can tell you is that the encouraging part isn’t that the risk is small. It’s that it’s happening in broad daylight rather than in the dark. Regulators globally are actively mapping the interconnections between private credit funds, banks, and insurers. That kind of scrutiny early in a credit cycle tends to be exactly what prevents a localized problem from turning systemic.
The parallel to gold is direct. Private credit’s core weakness is that its valuations are self-reported and its liquidity is limited. You often can’t independently verify what you hold, or sell it quickly. Gold is the opposite on both counts. It’s priced transparently every second on public markets. It’s liquid virtually anywhere in the world, any time. In a portfolio full of assets you have to take someone else’s word for, that transparency is worth something real.
So Should You Actually Be Worried?
Four real, data-backed pressures: rising debt costs, concentrated AI valuations, a housing market working through a genuine backlog, and a private credit sector under active scrutiny. None of them, on the numbers as they stand today, point to an imminent, sudden shock. All four point to the same quieter conclusion. Diversification, and a position in physical metals, keeps making structural sense heading into the back half of 2026.
That’s the headline version. There’s a second mechanism in the AI-concentration story, beyond the cash-flow-versus-debt distinction above. It changes how a correction there would actually transmit through markets, and we’ve left it out here on purpose. The Golds Show breaks it down in full. It also covers the payment-in-kind mechanic that lets private credit stress build quietly before anyone outside the industry notices.
Watch the full breakdown, including both mechanisms this article leaves out, in this episode of the GoldSilver show.
Stay On Top of Gold & Silver Prices
Get important market alerts sent straight to your inbox.
SOURCES
1. Peter G. Peterson Foundation, citing CBO data on federal interest costs, February 12, 2026
2. World Gold Council, 2026 Central Bank Gold Reserves Survey, June 16, 2026
3. J.P. Morgan Asset Management, S&P 500 concentration analysis, May 20, 2026
4. Gartner, 2026 global AI spending forecast, reported via Al Jazeera, February 19, 2026
5. ATTOM, Mid-Year 2026 U.S. Foreclosure Market Report, July 16, 2026
6. Fitch Ratings, U.S. private credit default rate reporting, March 6, 2026 and July 30, 2026
7. JPMorgan Chase, 2026 Annual Shareholder Letter, Jamie Dimon, April 6, 2026
Disclaimer: This article is for informational purposes only and does not constitute investment advice. Past performance is not indicative of future results. Always consult a qualified financial advisor before making investment decisions.
You May Also Like:
- Gold Beat Aircraft and Oil to Top America’s Export List. Nobody Agrees Why.
- One Freeze Taught Every Government a Lesson. China Is Still Acting on It.
- Rick Rule Sold 80% of His Silver. He Won’t Touch His Gold.
- Your Bank Balance Is Lying to You. The Number Is Real. The Wealth Isn’t.
- The Economy Lost 23,000 Jobs. Gold Climbed Toward $4,400. Here’s the Mechanism.
- Who Really Owns the World’s Gold? The Answer May Surprise You.
- The AI Trade Has Four Disguises and One Is in Your Portfolio
- What Is a Monetary Reset — and Is One Already Happening?