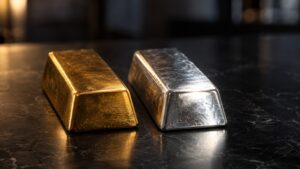
Silver Rises Over 120% YTD




Published: 05-27-2026, 12:13 pm
Key Takeaways
- Silver’s steeper drop versus gold isn’t random — it’s structural: roughly 58% of silver demand is industrial, so when economic uncertainty rises, that premium unwinds fast.
- Silver’s market is far thinner than gold’s, and central banks don’t hold it, meaning there’s no institutional floor to cushion a sell-off the way there is for gold.
- The silver market is in its sixth consecutive year of supply deficit (46.3 Moz shortfall projected for 2026), and 70% of new supply can’t respond to price signals — the same mechanism that amplifies the drop amplifies the recovery.
Approximately 58% of the world’s annual silver demand comes from factories — solar panels, electric vehicles, data centers, medical devices. In contrast, zero percent of the world’s annual gold demand comes from factories.
That single difference is the core reason why silver is falling faster than gold today.
Why is silver falling faster than gold today?
As of 11:03 a.m. ET on May 27, 2026, silver is trading at $74.42 per ounce, down $2.55 or 3.3% on the day [nFusion Solutions, May 27, 2026]. Gold is at $4,437, down $70 or 1.6%. In other words, silver is falling more than twice as fast.
The catalyst is a familiar one: renewed uncertainty in the Middle East. The U.S. military carried out what it described as self-defense strikes in southern Iran earlier today, even as a 60-day ceasefire framework remains under negotiation. As a result, oil prices rebounded, the dollar strengthened, and investors rotated out of risk assets.
However, the question isn’t why both metals are down. The real question is why silver is down twice as much.

The Edge Every Investor Needs Smarter precious metals investing starts here. The Nuggets Newsletter brings you essential market insights, Fed updates, global trends, educational videos, and much more.
What causes silver to drop more than gold?
The answer is structural, and it has three parts.
First, silver has a dual identity. Gold is almost purely a monetary metal — a store of value, a reserve asset held by central banks and sovereign wealth funds. Silver, by contrast, is both a monetary metal and an industrial commodity. When geopolitical risk rises and the economic outlook darkens, that industrial demand premium unwinds quickly. Manufacturers become cautious about supply chains, and industrial buyers pull back. Consequently, the approximately 58% of silver demand tied to factories starts to shrink — even as the roughly 42% tied to monetary demand holds firm or grows.
Gold doesn’t face this dynamic. No one stops buying gold because a factory closed.
Second, silver’s market is dramatically thinner. For example, London Bullion Market Association and CME Group data show that gold’s daily cleared volume routinely runs ten to fifteen times larger than silver’s. Because of this, the same dollar amount of selling pressure creates a much bigger percentage move in silver. When institutional traders reduce precious metals exposure, therefore, silver’s price moves farther and faster — in both directions.
Third, central banks don’t hold silver. According to the World Gold Council, central banks purchased over 1,000 tonnes of gold annually for three consecutive years through 2024. That sustained institutional bid creates a structural floor under gold that silver simply doesn’t have. So when selling pressure hits, gold has a buyer of last resort. Silver doesn’t.
What happens after silver’s biggest single-day drops?
History suggests that patience pays. According to the Silver Institute and Metals Focus, the silver market is in its sixth consecutive annual supply deficit — a projected 46.3 million ounce shortfall in 2026 alone. That deficit exists because roughly 70% of the world’s silver supply is a byproduct of mining other metals like copper, lead, and zinc [Silver Institute, World Silver Survey 2026]. When silver prices fall, mine supply doesn’t meaningfully increase, because the mines producing it aren’t primarily silver mines.
Furthermore, above-ground stockpiles are being drawn down year after year. Each pullback therefore removes metal from a shrinking pool.
Importantly, the amplification mechanism works in reverse, too. When sentiment shifts — when a ceasefire holds, when inflation data cools, or when the Fed signals patience — silver tends to recover faster and farther than gold. The same thin market that amplifies the fall amplifies the recovery. (See: our March analysis of what happens after silver’s biggest drops.)
Should you buy silver during a pullback?
The answer depends on your time horizon. For a day trader, today’s 3.3% drop is simply a data point. An investor who understands that they’re buying a metal with six consecutive years of supply deficits — where 70% of new supply can’t respond to price signals, and where the same structural forces driving gold (monetary debasement, fiscal dominance, de-dollarization) apply with an industrial kicker on top — sees the picture very differently.
Today’s price is $74.42. A year ago, it was around $33.
Consequently, silver’s volatility isn’t a warning. It’s the mechanism. The same dual nature that amplifies the drop amplifies the recovery. Understanding that distinction — rather than panicking at the headline — is what separates an informed allocation from a reactive one.
Tomorrow brings the Q1 GDP second estimate, PCE inflation data, and jobless claims — all three in a single session. If the data runs hotter than expected, precious metals face another wave of selling pressure. Should it cool, however, the recovery trade could be swift. Silver, as always, will move first and move farther. (Related: the structural supply gap we detailed last week.)
That’s the definition of financial sovereignty — owning an asset whose fundamentals you understand well enough to hold through the noise.
Stay On Top of Gold & Silver Prices
Get important market alerts sent straight to your inbox.
SOURCES
1. nFusion Solutions — Live Spot Price Data, May 27, 2026
2. Silver Institute / Metals Focus — World Silver Survey 2026
3. World Gold Council — Gold Demand Trends Full Year 2025: Central Banks
4. GoldSilver.com — Silver Price Crash History: What Happens After the Biggest Drops?
5. GoldSilver.com — Silver Industrial Demand: Solar, EVs, and the Supply Gap
Disclaimer: This article is for informational purposes only and does not constitute financial or investment advice. Always consult a qualified financial adviser before making investment decisions.
You May Also Like:
- Gold Down 1.2%, Silver Down 2.8% — The Floor Holds
- UBS Just Cut Its Gold Target by $400. The Part They Kept Is the Real Story.
- Why Gold Is Falling Today — And Why $4,500 Is Holding.
- Gold Is Down Today. Here’s Why Smart Money Is Still Buying.
- Silver Up 3%. Gold Up 1.3%. The Ratio Tells You Everything.
- Iran News Sent Gold Price Both Ways. The Driver Was Never Iran.
- Gold Falls 0.5% on Iran Deal: The Floor Holds
- Is Gold Being Repriced? 5 Major Institutions Say Yes.