Gold vs. Stocks: What Long-Term Ratios Are Telling Investors

US household equity exposure just hit an all-time high. The Buffett Indicator is near record levels. And gold has quietly outperformed the S&P 500 — including dividends — since 2002. Here’s what the long-term data is saying.
Dow to Gold Ratio: 100 Years of History Decoded
Gold has gained roughly 15.6% since January 1, 2026, while the Dow is up just 2.7% over the same stretch. That gap doesn’t register in most financial headlines — but the Dow to gold ratio captures it with precision. Right now, the ratio reads approximately 10: it takes around 10 ounces of gold to match one unit of the Dow index. At the dot-com peak in 1999, it took 43. What does that shift tell us, and where does it go from here?
What Is a Wealth Cycle? Price vs. Value Explained
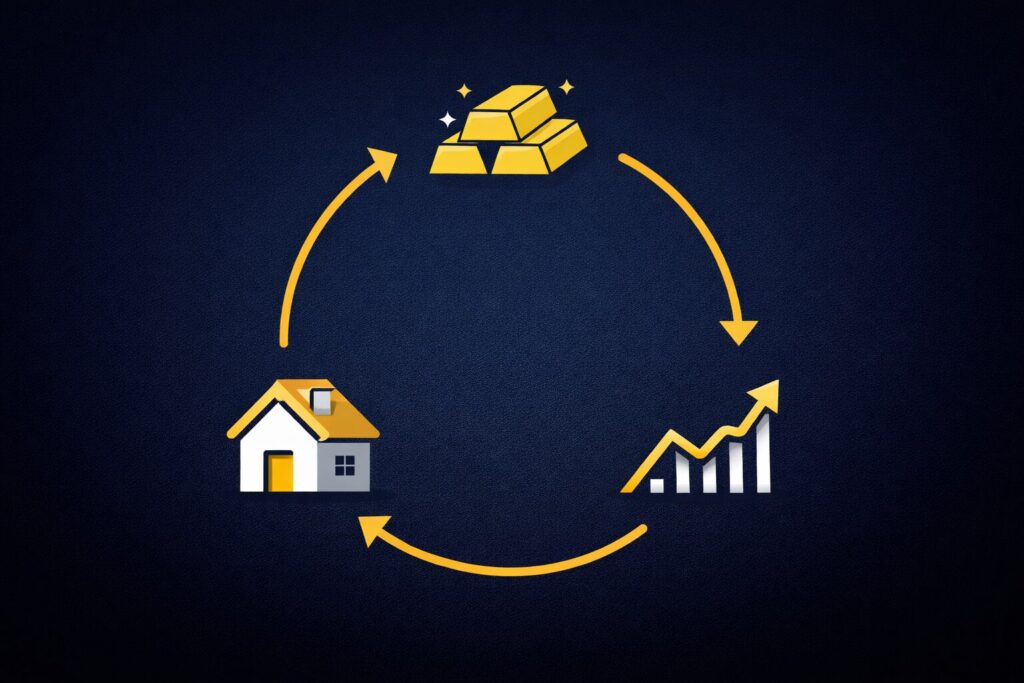
Most investors watch prices. Smart investors watch value. Learn what a wealth cycle is, how the Dow-to-gold ratio reveals it, and why the difference between price and value is the foundation of real wealth-building.
