 Silver Rises Over 120% YTD




Gold Had Every Reason to Rally Today. It Didn’t. Five Reasons Why.
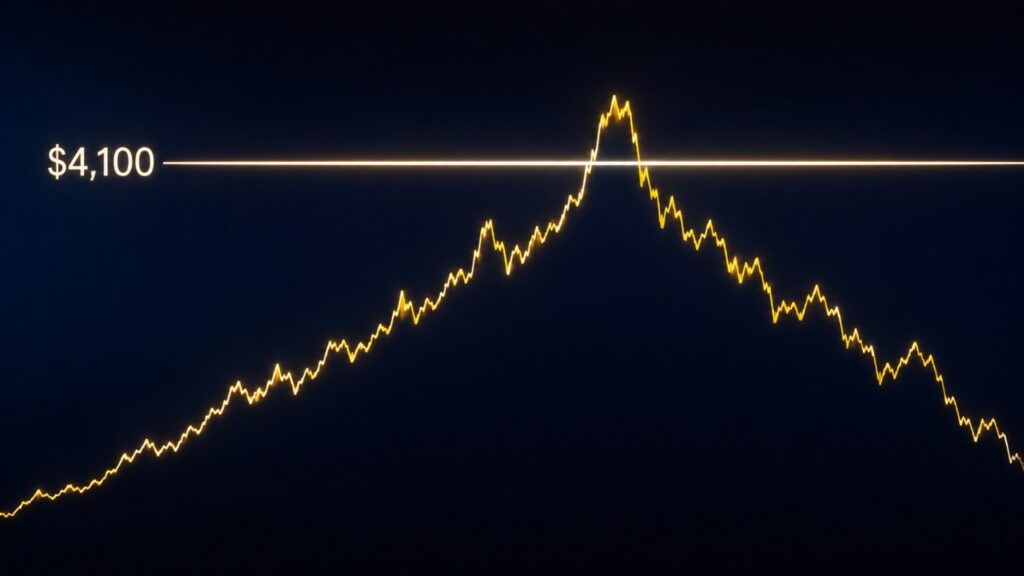
Gold opened above $4,100 this morning and gave it back within hours. Five forces explain why the rally didn’t hold: the Bank of Japan held rates as the yen hit a 40-year low, the US-Iran pause faded, Q2 GDP missed forecasts, the Fed voted 9-to-3 to hold with three regional presidents pushing to hike, and the gold-silver ratio sits near 70.
Central Banks Bought 289 Tonnes of Gold Last Quarter. Prices Were Falling the Whole Time.
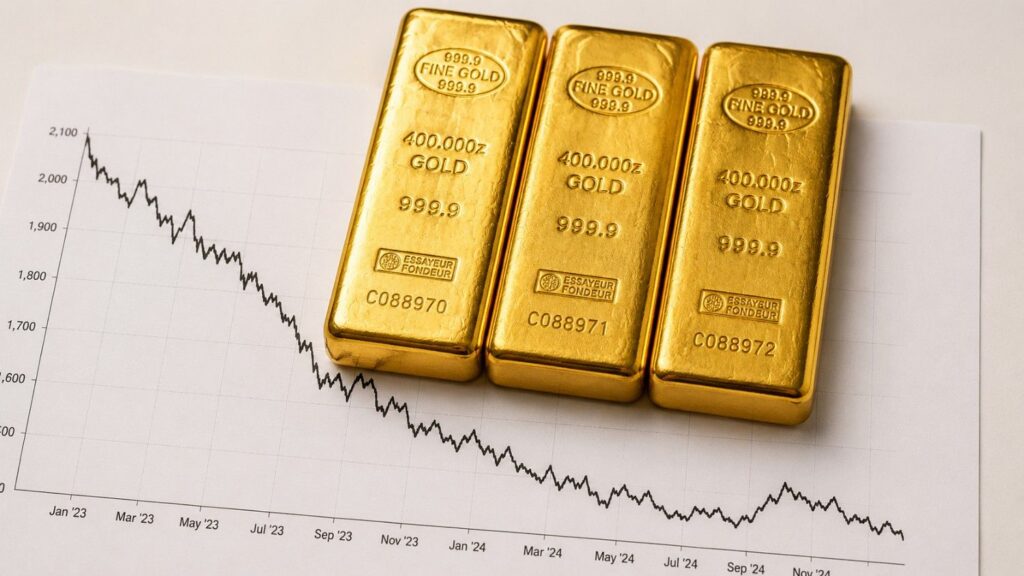
Central banks bought a record 289 tonnes of gold in Q2 2026 — while prices posted their steepest quarterly decline in a decade. The World Gold Council just published the data. Here’s what the buying pattern reveals about where the world’s largest reserve managers think the monetary system is heading.
Gold & Silver Market Correction: Is the 2026 Bull Market Over?

Gold fell nearly 28% from its January 2026 all-time high. Silver dropped over 52%. Here is what caused the correction, why the structural bull case remains intact, and what central banks, the WGC, and institutional forecasters say about where gold and silver go from here.
Why China’s Gold Buying Spree Outweighs India’s Pause
China’s bar and coin gold demand hit a record 207 tonnes in Q1 2026 while India paused on a 15% import duty hike. Here’s why the divergence matters — and what it means for your physical gold allocation.
The Buyer List for Gold Just Got Longer. These Countries Have Never Bought Before.
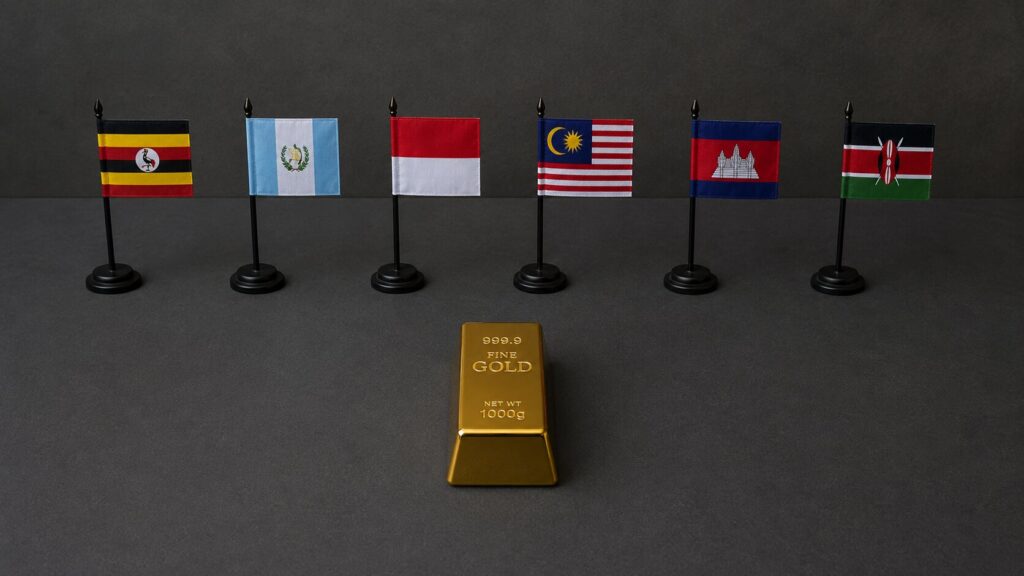
Central banks purchased a net 244 tonnes of gold in Q1 2026 — and for the first time, the buyer list includes countries like Guatemala, Indonesia, Malaysia, Cambodia, Uganda, and Kenya. Some are buying gold for the first time in their institutional history. Others are returning after decades of absence. Here is what the world’s most sophisticated reserve managers are telling you by voting with their balance sheets.
Gold Reserves by Country: The 2026 Rankings

The US still leads with 8,133.5 tonnes — but the real story is who’s buying. Central banks purchased a net 244 tonnes in Q1 2026 alone. Here’s what the data reveals.
What Moves Gold Prices? 6 Key Gold Price Factors Explained
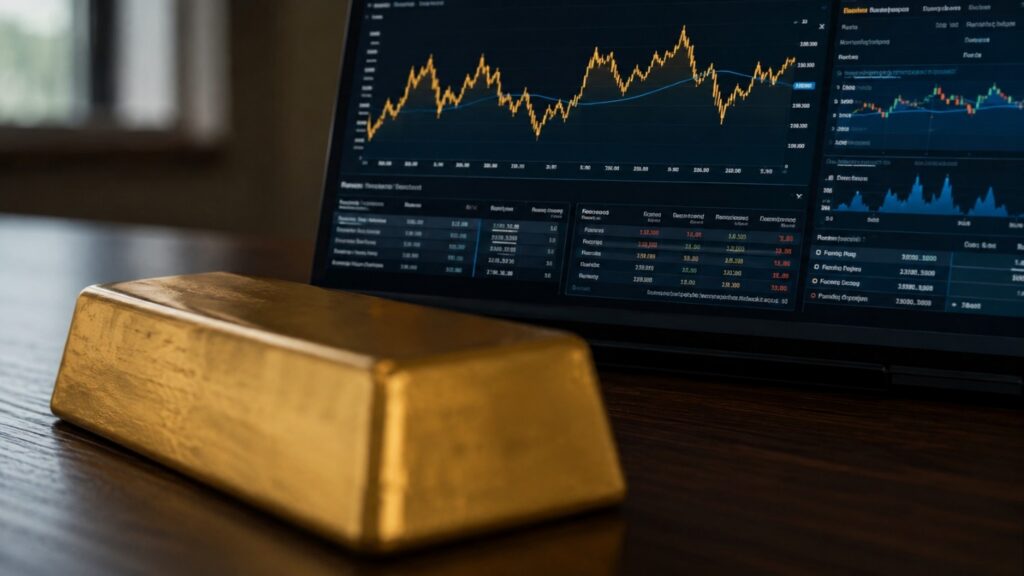
Gold hit an all-time high of $5,589 in January 2026 — then pulled back 18%. Here are the six macroeconomic factors that move gold prices, and why understanding them matters more than tracking the daily chart.
World Bank: Precious Metals to Surge 42% This Year
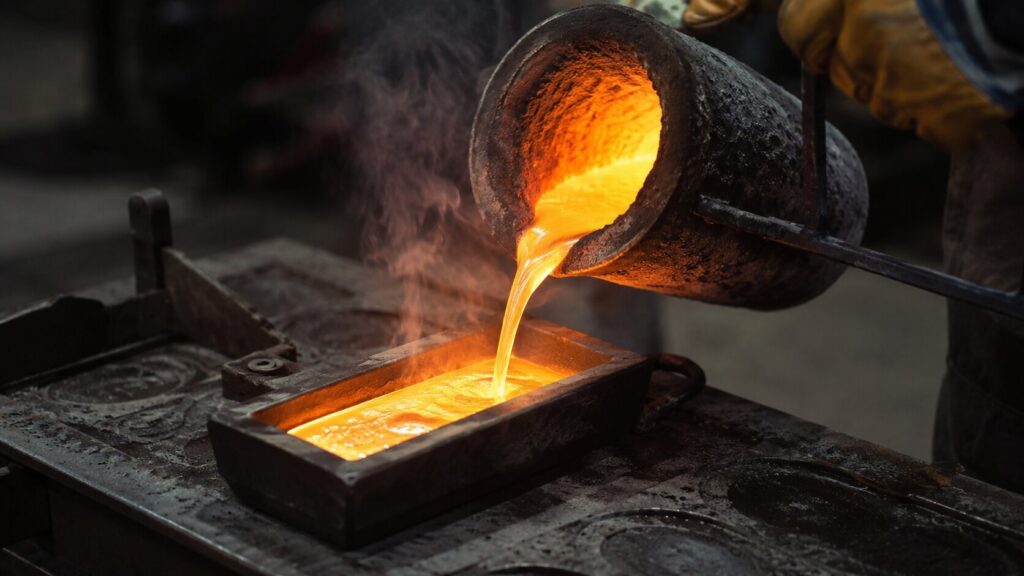
The World Bank’s April 2026 Commodity Markets Outlook projects a 42% surge for gold and silver — outpacing every other commodity class. Here’s what’s driving the forecast and what it means for long-term investors.
Why Central Banks Sell Gold — And What It Means for Prices
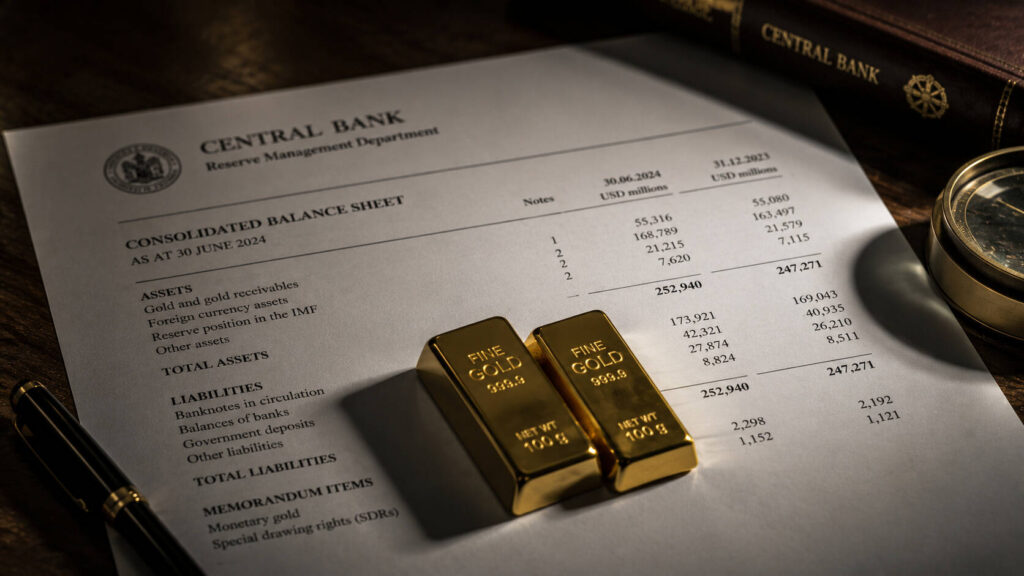
Central banks bought 863 tonnes of gold in 2025. Yet Russia, Turkey, and others are selling. Here’s what drives official-sector gold sales — and what the history of central bank selling tells long-term investors about price risk.
Why Gold Deserves a Permanent Spot in Your Portfolio
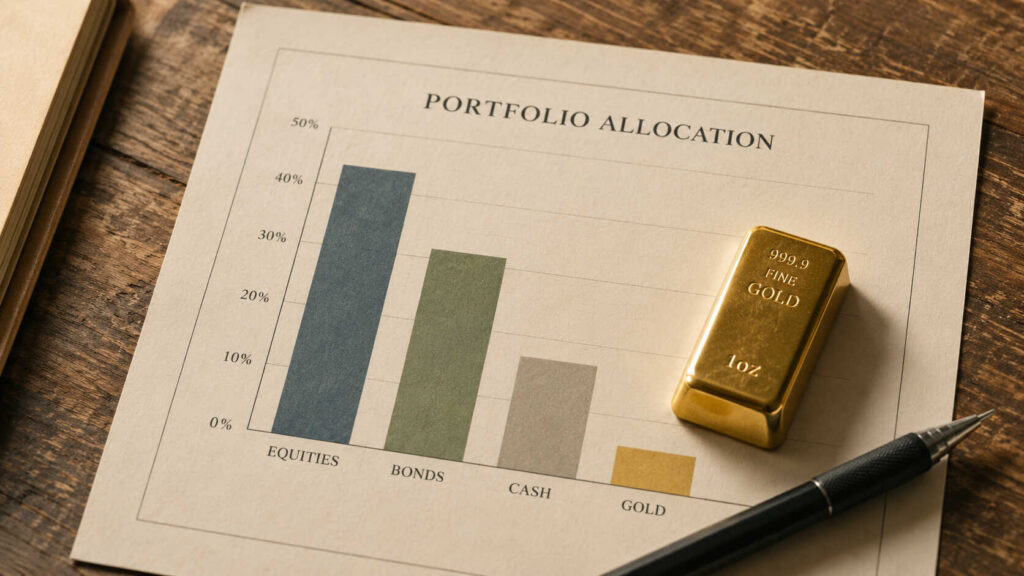
Central banks bought 863 tonnes of gold in 2025 at record prices. Institutional allocations are rising. The 60/40 portfolio has structurally weakened. The case for gold as a permanent portfolio holding has never been more data-driven.


