 Silver Rises Over 120% YTD




Gold Fell 47 Percent in the 1970s Before Its Biggest Run. The Chart Looks Like Right Now.

In the middle of the 1970s gold bull market, gold fell 47 percent. Most investors sold. The ones who held watched it run nearly eight times from that low to the January 1980 peak. GoldSilver’s Megan King Diaz walks through the historical chart — and draws the parallel to where gold sits right now.
Gold Price History: From $35 to $4,500 in 100 Years
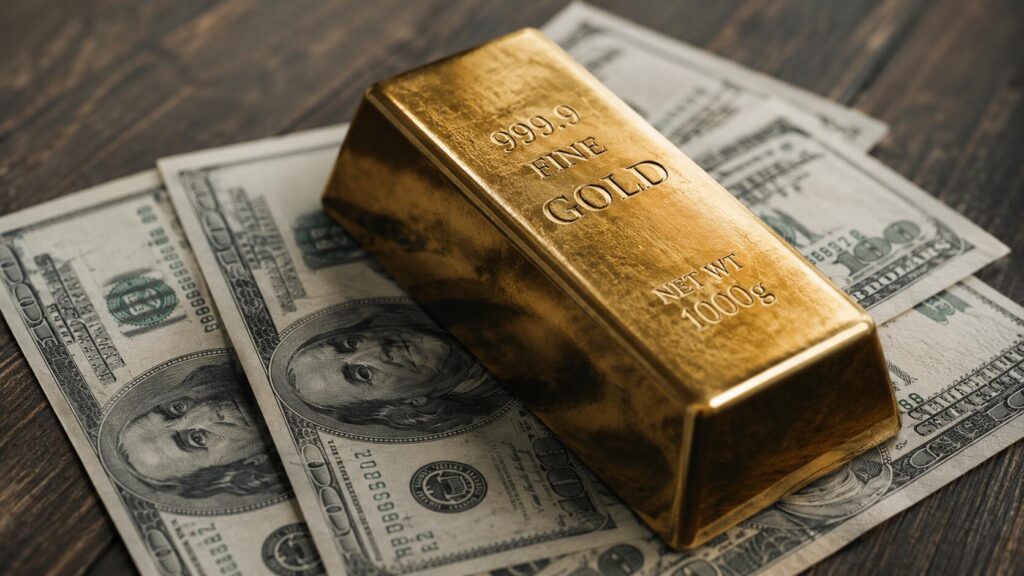
Gold went from $35 in 1971 to around $4,500 today — a 12,000% gain since the gold standard ended. Meanwhile, the dollar lost 96.9% of its purchasing power over the same period. These are not two separate stories. This is the complete gold price history: decade by decade, the real cause behind every major move, and what a century of data tells investors right now.


