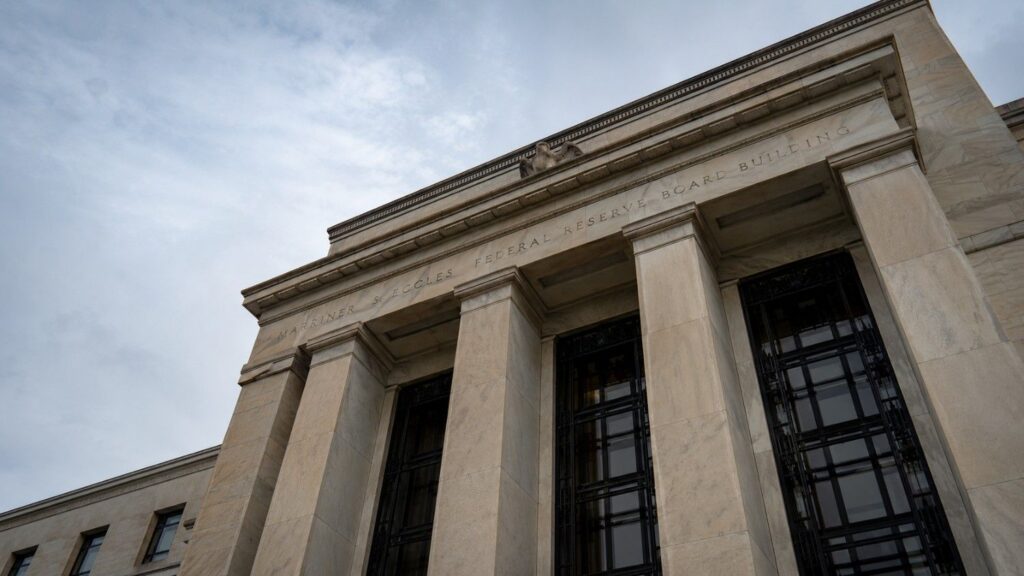
Warsh Told Wall Street to Stop Watching the Fed. Gold Already Knew.
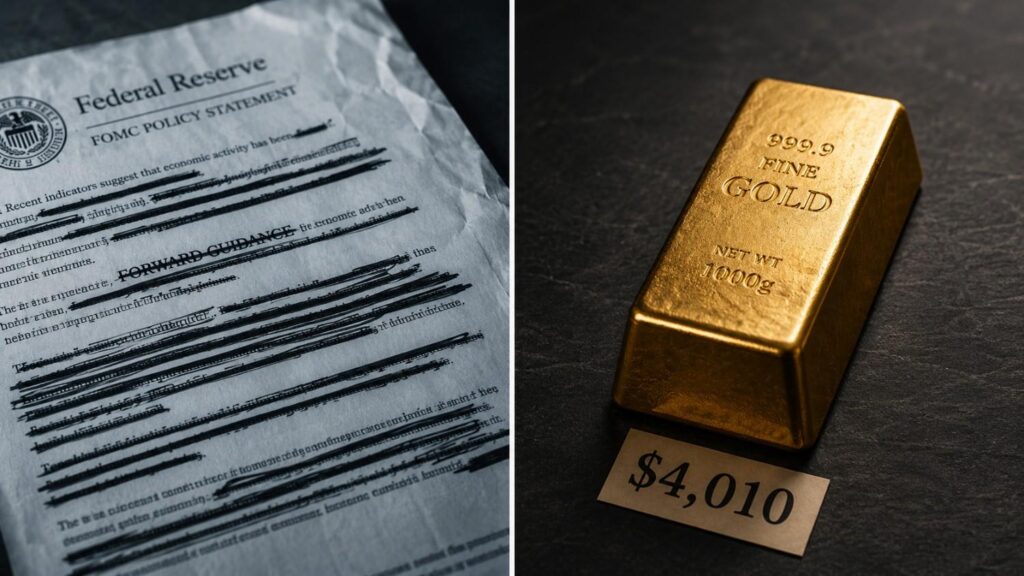
Fed Chair Warsh told Congress to stop trading his guidance and start trading the data. Gold price and Fed policy in 2026 now run on the same rulebook physical holders have always used. Here’s the mechanism behind today’s $4,007 close — and the one number that determines what happens next.
What Is Purchasing Power — and Why Every Dollar You Save Is Slowly Being Taxed Away
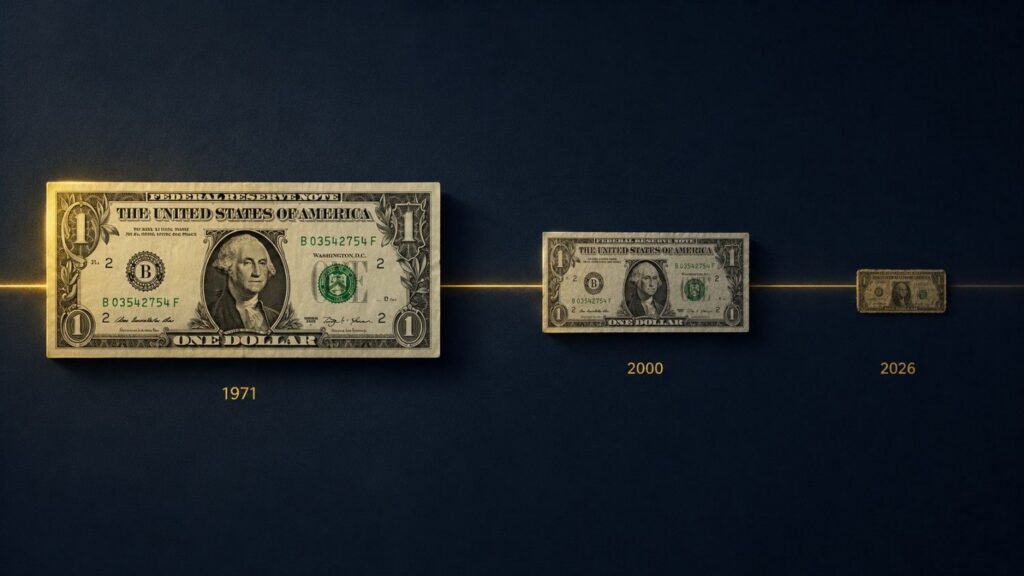
The dollar has lost 87% of its purchasing power since 1971. Learn what purchasing power actually is, why fiat currency erodes it, and why gold doesn’t.
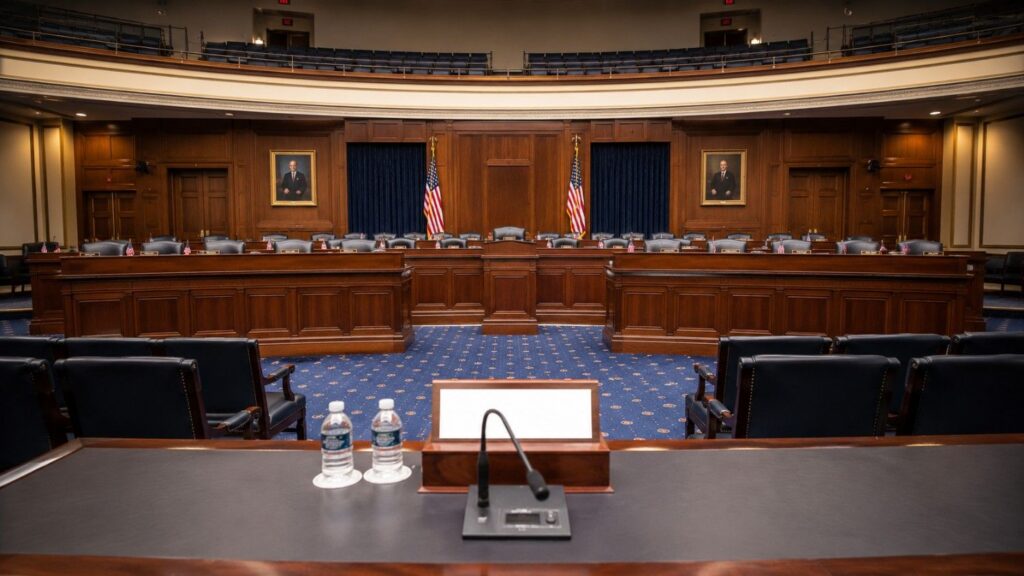
Warsh Testified. Gold Jumped $90. The Signal Everybody Missed Was in His Report.
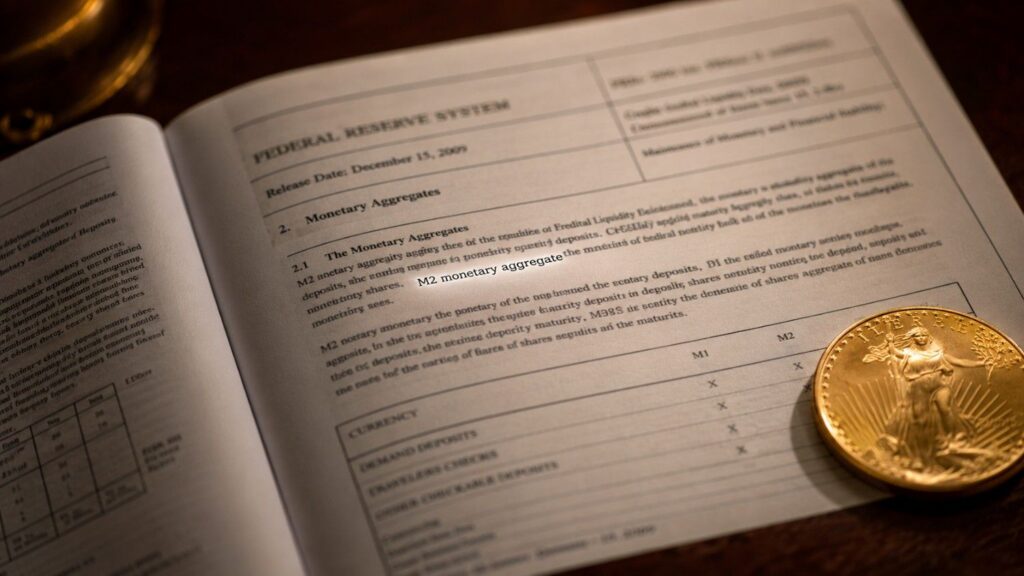
Gold jumped $90 this morning after June CPI printed its biggest monthly drop since April 2020. But the more important signal came from a 57-page document almost nobody read — and it has direct implications for long-term gold holders.
Gold Jumped $90 This Morning. June CPI Just Explained Why.
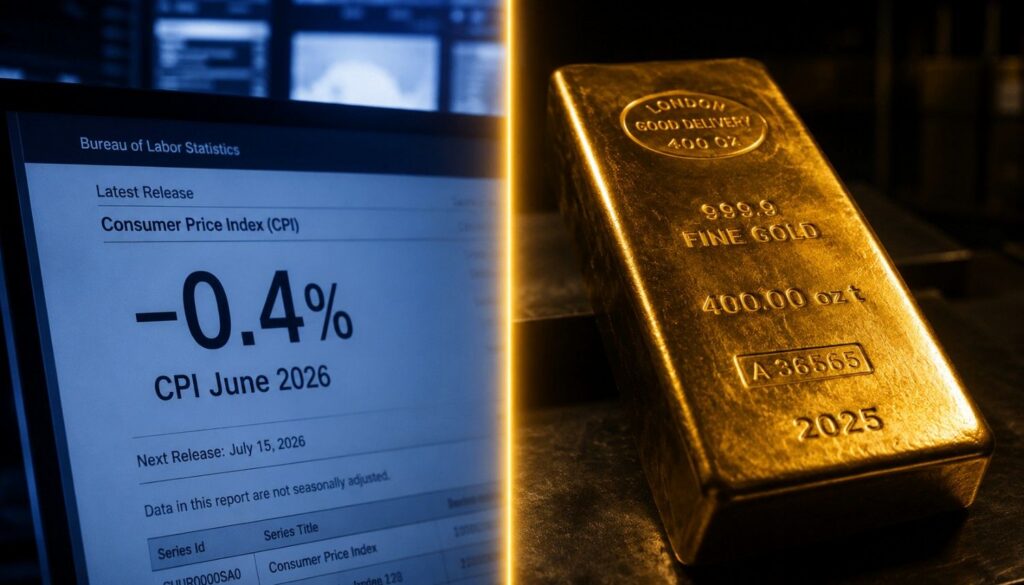
Gold jumped $90 and silver rose 3% after June CPI printed −0.4% — its largest monthly drop since April 2020. Here’s the real-yield mechanism behind the move, and why the headline relief is already reversing.
Trump’s Hormuz Toll Is an Inflation Tax. Here’s Why Gold Fell.

Trump’s 20% Hormuz toll sent oil higher and gold to $4,005. Here’s the exact four-step mechanism connecting a shipping levy to a falling gold price — and why the same inflation it creates is the long-term case for owning physical metal.
Trump Declared the Ceasefire Over. Gold Barely Moved.
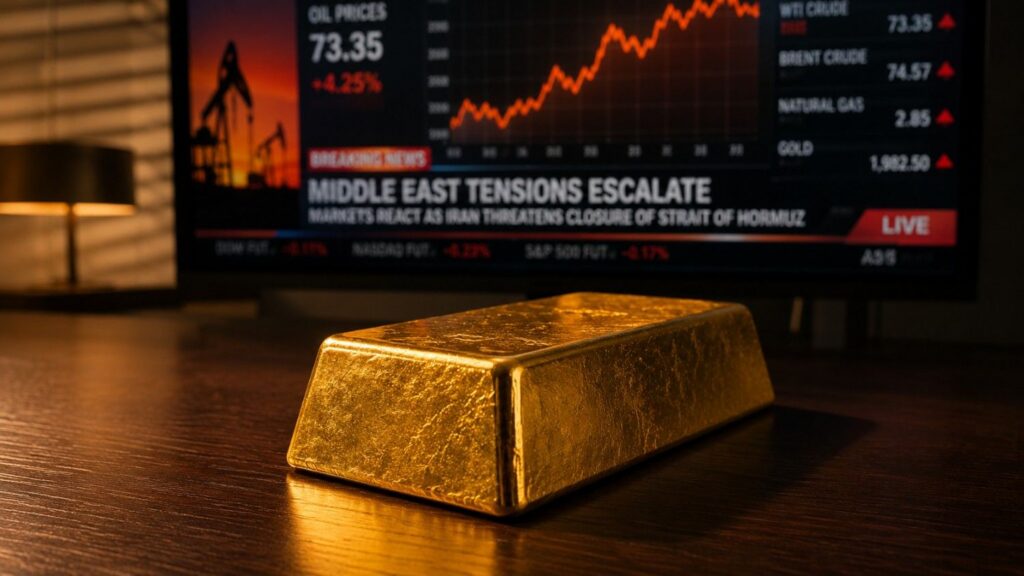
Trump declared the Iran ceasefire over on July 10. Gold fell 0.5%. Here is the mechanism that explains why geopolitical risk has been suppressing gold prices all year — and why Tuesday’s CPI print matters far more than any missile strike.
Five Days From Now, Two Numbers Will Decide Gold’s Second Half
Gold is trading at $4,134 today as two market-moving events converge on Monday, July 14. June CPI drops at 8:30 AM ET. Fed Chair Warsh testifies 90 minutes later. Here’s the exact mechanism connecting both to gold and silver prices — and three scenarios for what happens next.
How the Jobs Report Moves Gold and Silver: The Five-Step Chain Behind Every Move
When the U.S. jobs report misses expectations, gold and silver prices typically rise. When payrolls beat, they fall. The relationship runs through a specific five-step chain — and once you understand it, the monthly reaction stops being a mystery.
What Is Financial Repression? The Four-Move Government Debt Playbook, Explained.

What is financial repression? It is one of four moves governments make when debt becomes unmanageable. As of mid-2026, it is the one already running. GoldSilver’s Maggie Lake and David Morgan of The Morgan Report explain the full playbook, the gold revaluation math, and why physical metal sits outside all four.
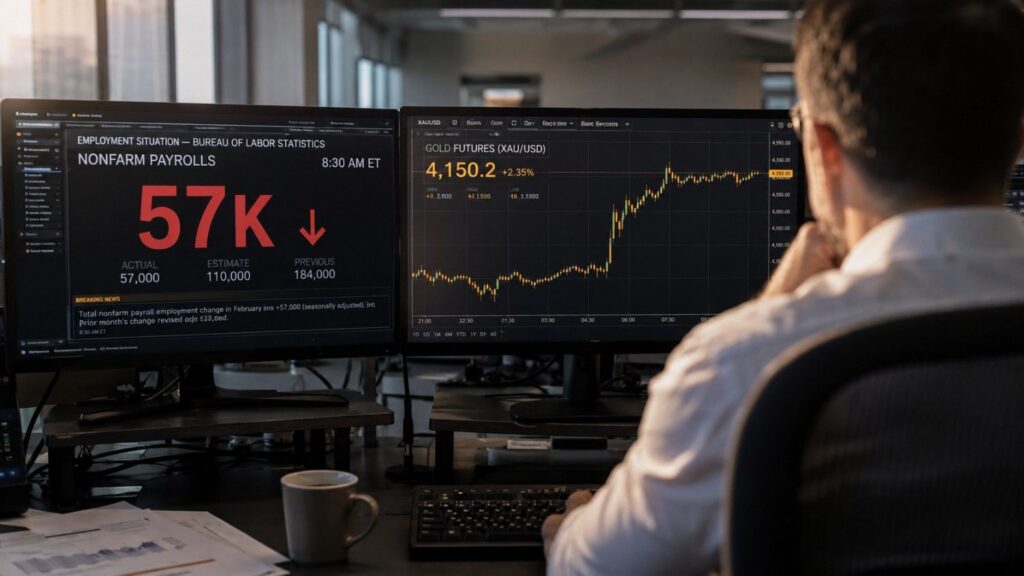
Gold Hits 3-Week High as Fed Hike Odds Halve on Jobs Miss
June’s jobs report added just 57,000 positions — less than half the forecast. Fed rate hike odds for July 29 fell to 22%. Gold hit a 3-week high. Here’s the mechanism.
