Warsh Called Inflation “Too High.” He Also Said the Risk Is Fading. Gold Noticed.

Gold and silver jumped Wednesday after Fed Chair Kevin Warsh softened his hawkish tone at the ECB’s Sintra forum — a shift that matters more than the day’s ADP miss. Here’s the real-yield mechanism behind the move, and why Thursday’s early jobs report is now the number to watch.
172,000 Jobs Doubled the Forecast. Thursday’s Report Could Move Gold Again.
Every month, one government report moves gold’s paper price more than almost anything else. Thursday’s June jobs report is no different. Here’s the mechanism behind the move — and a three-scenario framework for what each outcome means for gold before 8:30 AM ET.
Why Is Silver Down 5%? The Gold-Silver Ratio Explains.
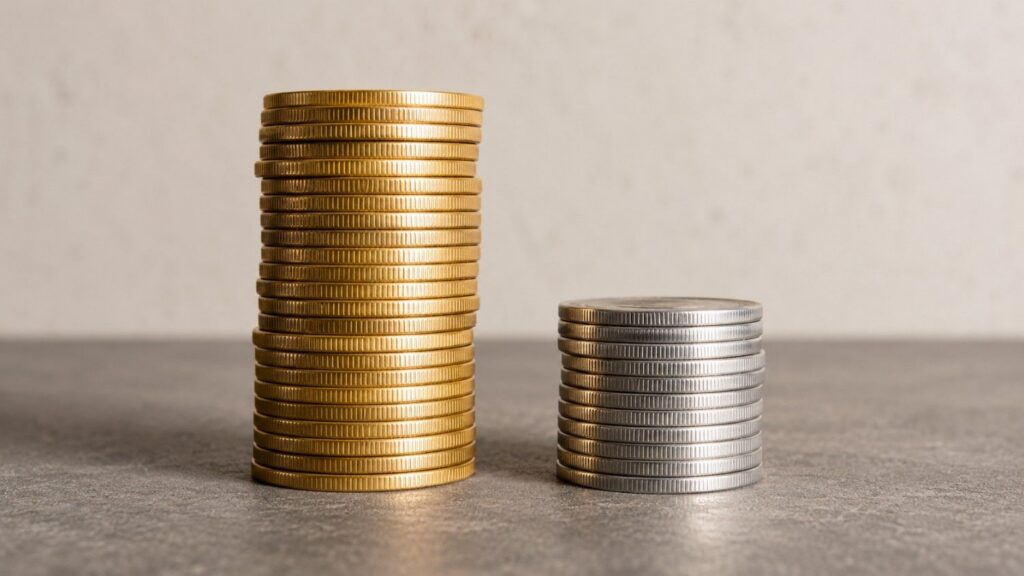
Gold is down 1.7% today. Silver is down 5.4%. The gold-silver ratio just hit 67 — and it’s not a valuation signal. It’s a real-time diagnostic of two forces colliding: the Iran peace dividend versus the Fed’s rate-hike threat. Here’s which one is winning, and why Thursday’s PCE report is the swing factor.
PCE Drops Thursday. Here’s What It Means for Gold.
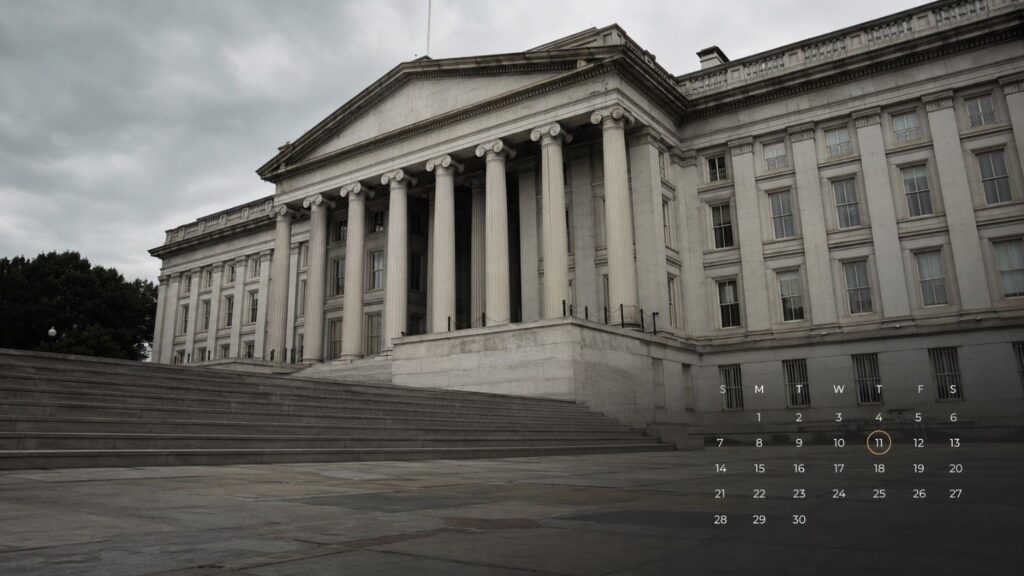
The Fed doesn’t watch CPI. It watches PCE — and the May reading drops Thursday, June 25. Here’s the mechanism linking this one number to gold prices, rate-hike odds, and what long-term holders need to understand before the week is out.
Half the Fed Wants a Hike. 45% of Central Banks Are Buying More Gold.

The Fed’s June 2026 dot plot split the committee down the middle on rate hikes, the dollar surged to its highest since May 2025, and silver posted its sharpest drop in weeks before recovering nearly 70% of the loss. The same week, the World Gold Council reported a record 45% of central banks plan to add gold. The headwinds are real. So is the floor.
The Fed Went Silent. Gold Holders Don’t Need It to Speak.
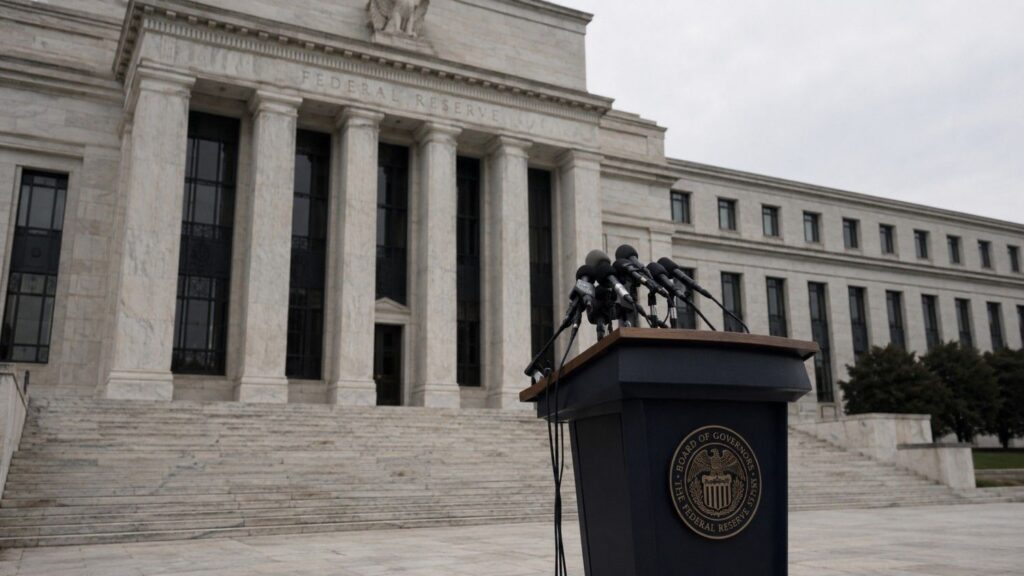
Kevin Warsh scrapped forward guidance and skipped the dot plot at his first Fed meeting. Paper gold fell 2%, then recovered. Here’s why the biggest shift in Fed communication since 2008 leaves the structural case for physical gold exactly where it was.
Iran Peace Deal Sends Oil Down 5%, Gold Up 3%
The Iran peace deal was supposed to hurt gold. It didn’t. Here’s why oil falling 5% is pushing gold higher — and what that tells long-term holders about the monetary chain driving precious metals right now.
Gold & Silver Surge on Iran Peace Deal — Then Pull Back

Gold and silver surged Friday on Iran peace deal hopes, then pulled back. The real story is the oil drop — and the inflation chain it may be unwinding. Here’s the mechanism behind today’s move and what it means heading into the Fed’s first meeting under Kevin Warsh on June 16–17.
Silver Fell 22% in 30 Days. Gold-Silver Ratio Hits 63.
Over the past 30 days, silver has fallen more than twice as fast as gold. The gold-silver ratio now sits at 63 — up more than 8 points in a month. That move has a name, a mechanism, and a track record. Here is what drove it, and what comes next.
Every Bearish Catalyst Landed at Once. Gold and Silver Went Up Anyway.

Every bearish macro catalyst landed today at once — hot PPI, an ECB rate hike for the first time since September 2023, and a second night of US-Iran strikes. Silver opened at its lowest level since December 2025. By afternoon it was up 3.6%. Here’s what that market signal means for physical holders and what to watch before the FOMC on June 17.
