Silver Price Outlook June 2026: The Correction Was the Setup
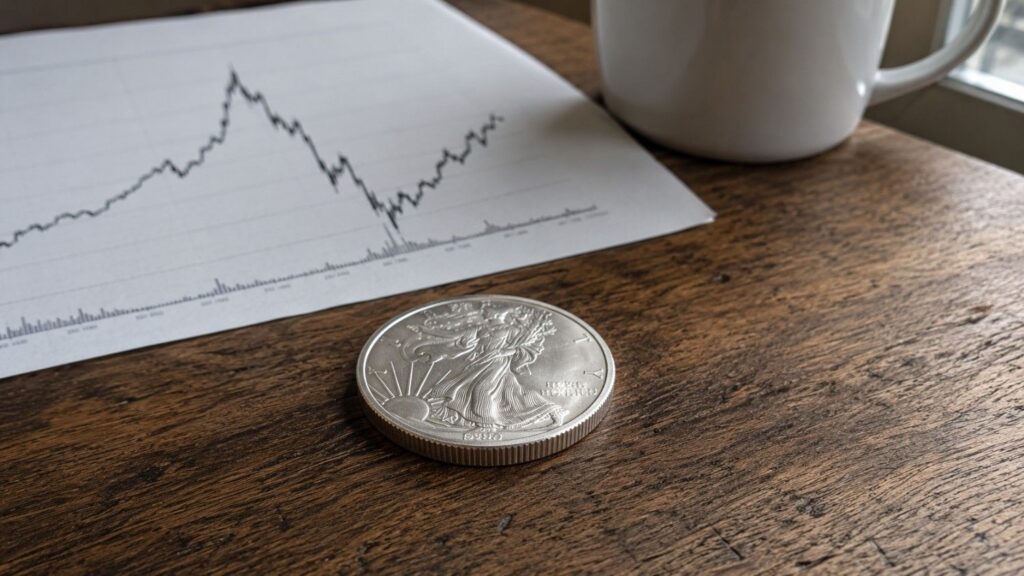
Silver has fallen 42% from its January 2026 all-time high of $121.62. Most investors are reading that as a failed rally. We think it’s the opposite. Here’s what the data, the supply deficit, and the gold-silver ratio are actually saying about where silver goes from here.
Gold at $4,480: Physical Demand Hits a 50-Year Milestone
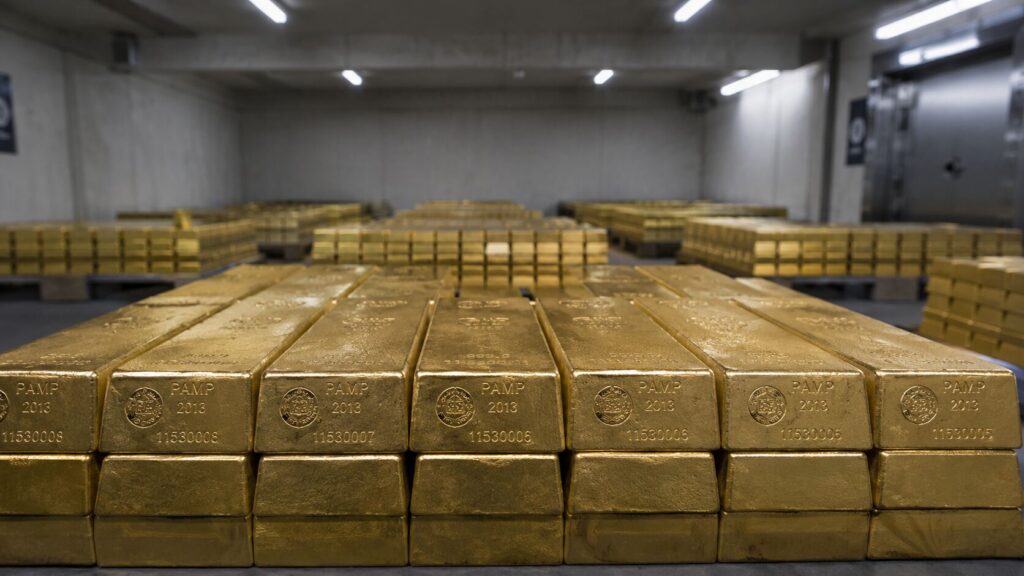
Central banks reshape gold markets through the most concentrated sovereign buying in decades — but that’s only one of five forces moving gold right now. Physical investment is overtaking jewelry demand for the first time on record. Russia’s figures don’t add up. China just hit the brakes. Here’s what’s driving the market.
Gold Price History: From $35 to $4,500 in 100 Years
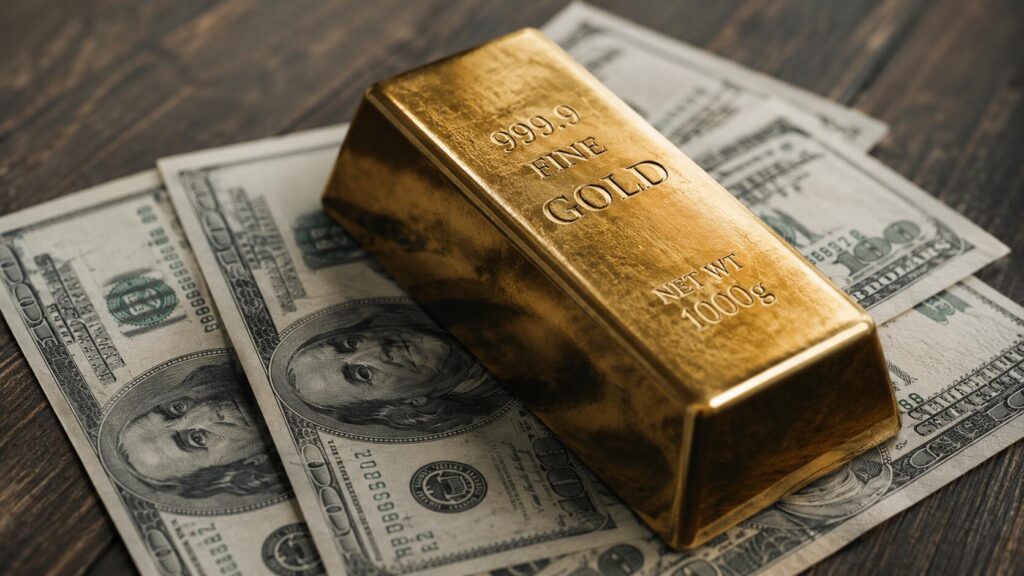
Gold went from $35 in 1971 to around $4,500 today — a 12,000% gain since the gold standard ended. Meanwhile, the dollar lost 96.9% of its purchasing power over the same period. These are not two separate stories. This is the complete gold price history: decade by decade, the real cause behind every major move, and what a century of data tells investors right now.
The Debasement Trade Explained: Mechanism, History, and What It Means for Gold

Five years ago, “debasement trade” was Austrian economics jargon. Today Goldman Sachs, Citi, and J.P. Morgan use it in their research notes. Here’s what it means, why it works, and why gold and silver are the primary instruments.
PCE Hit 3.8%. GDP: 1.6%. Gold Went Up. Here’s the Mechanism.
Yesterday’s BEA data confirmed what gold investors have been tracking all year: slow growth, hot inflation, and a new Fed chair with no clean policy options. Gold rose 1.5% on the day. Here’s why — and what comes next.
Gold or Silver First? A First-Time Buyer’s Framework
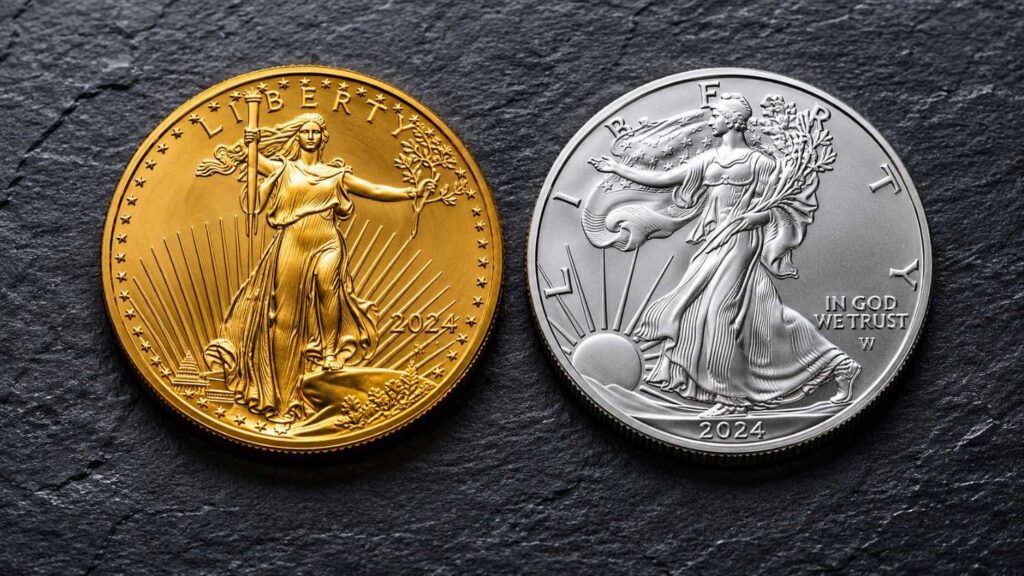
Most guides tell you gold is safer and silver is cheaper. That’s true and useless. This 4-question framework maps your budget, goals, storage, and liquidity needs to a clear starting point — so your first precious metals purchase is the right one.
Why Your Savings Lose Value — And How Gold Fixes the Leak

Modern investing feels overwhelming because the system — not the investor — is broken. Fiat currency punishes savers, forces speculation, and creates the leaky bucket problem at the center of modern financial stress. Here’s what’s actually draining your wealth, and why gold may be the simplest way to fix it.
Gold Portfolio Allocation: Why Wall Street Is Rewriting the 60/40

For forty years, the 60/40 portfolio was the default prescription for the serious investor. That model worked because stocks and bonds moved in opposite directions when markets got scared. That relationship is broken — and the institutions that built trillion-dollar businesses on it are now replacing bonds with gold.
Why Is Gold Valuable? The 5,000-Year Answer Most Investors Get Wrong

Gold is valuable because no other element combines physical scarcity, chemical indestructibility, and 5,000 years of universal monetary recognition. Here’s the full explanation.
Gold to Oil Ratio: The Ultimate Guide for Economic & Portfolio Analysis

The gold-to-oil ratio has tracked monetary and economic conditions for over a century. This guide explains how to calculate it, what its historical range means, how it signals inflation and dollar risk, and how to use it as a practical portfolio analysis tool — without relying on a single day’s prices.
