Gold & Silver Supply and Demand: What Really Drives Prices Over Time
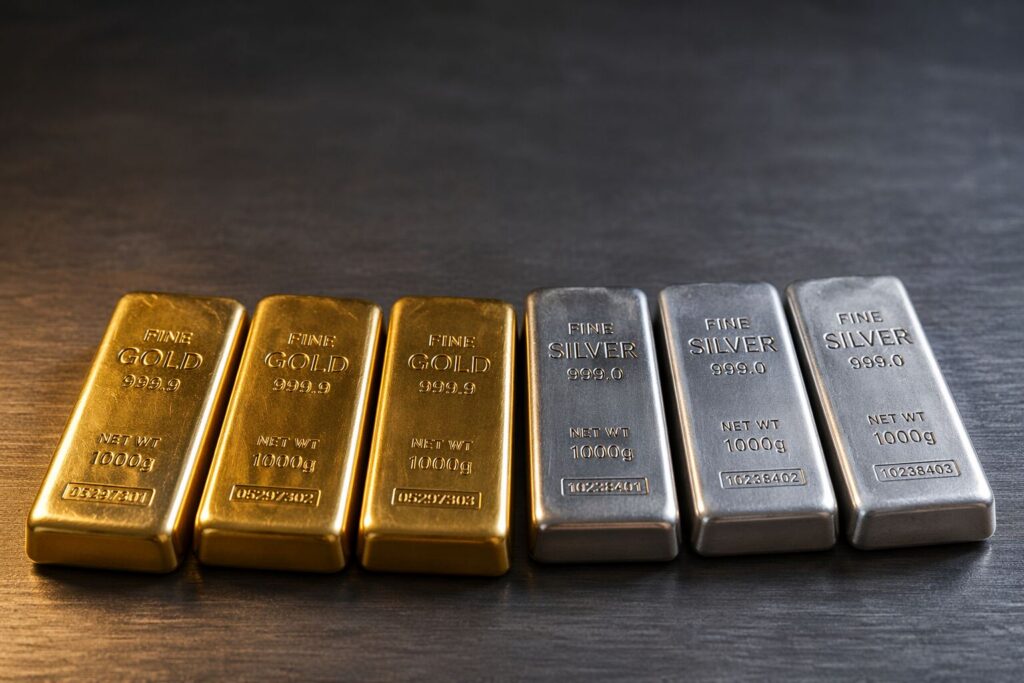
Gold and silver prices don’t move by chance. Discover the key supply and demand forces — from central bank activity and real interest rates to silver’s growing industrial role in solar and EVs — that drive precious metals prices over time and what they mean for your portfolio.
Gold Prices and Real Interest Rates: What Every Investor Must Know
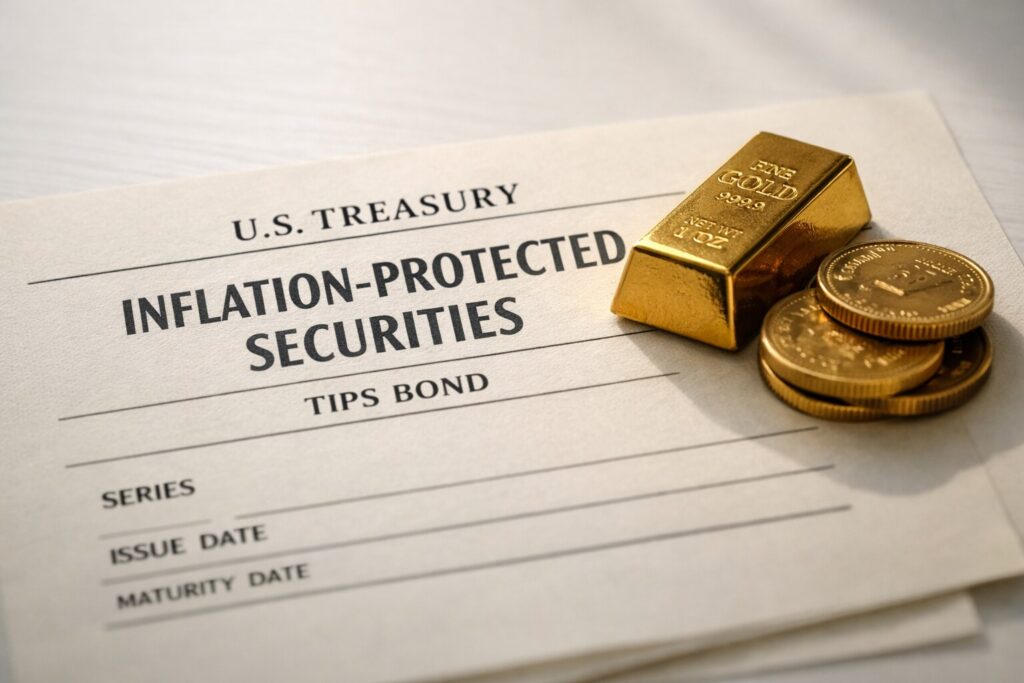
Real interest rates — not headlines — drive gold prices. When real yields fall, gold rises. When they rise, gold faces headwinds. Learn how to read the 10-year TIPS yield, breakeven inflation rate, and Fed rate expectations to anticipate gold’s next move and align your precious metals allocation accordingly.
UBS Forecasts Gold Above $6,000 — Should You Buy Now?

UBS forecasts gold to rise 20% by end-2026, targeting $5,900–$6,200 per ounce. Learn what’s driving the rally, whether now is the right time to buy, and how to position your precious metals portfolio for maximum impact.
Gold vs Inflation: What 100 Years of Data Shows
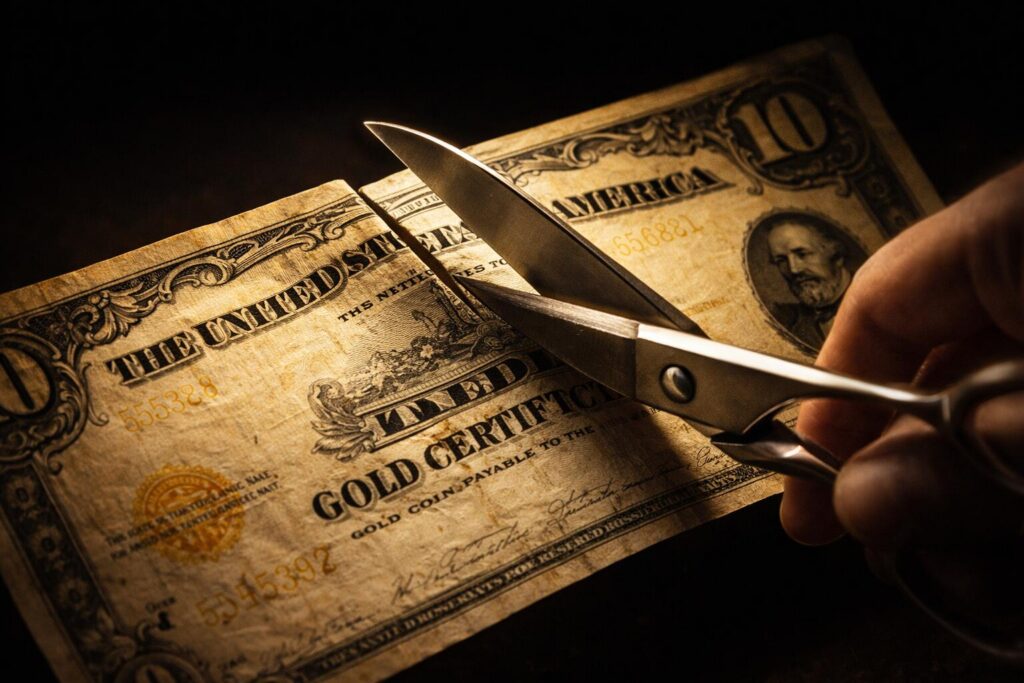
Gold has outlasted every currency it has ever been compared to. But does 100 years of data actually prove it’s a reliable inflation hedge? We break down the key periods — from the Nixon Shock to the 2024 all-time highs — to show exactly when gold shines, when it struggles, and what that means for your portfolio today.
Gold Silver Prices: Short-Term Noise, Long-Term Signal
Gold and silver prices are full of short-term noise—daily swings driven by Fed commentary, currency moves, and speculative trading. But underneath the volatility lies a consistent long-term signal. Learn how to tell the difference, what structural forces actually drive precious metals prices over time, and how to build a strategy that stays focused on what matters most.
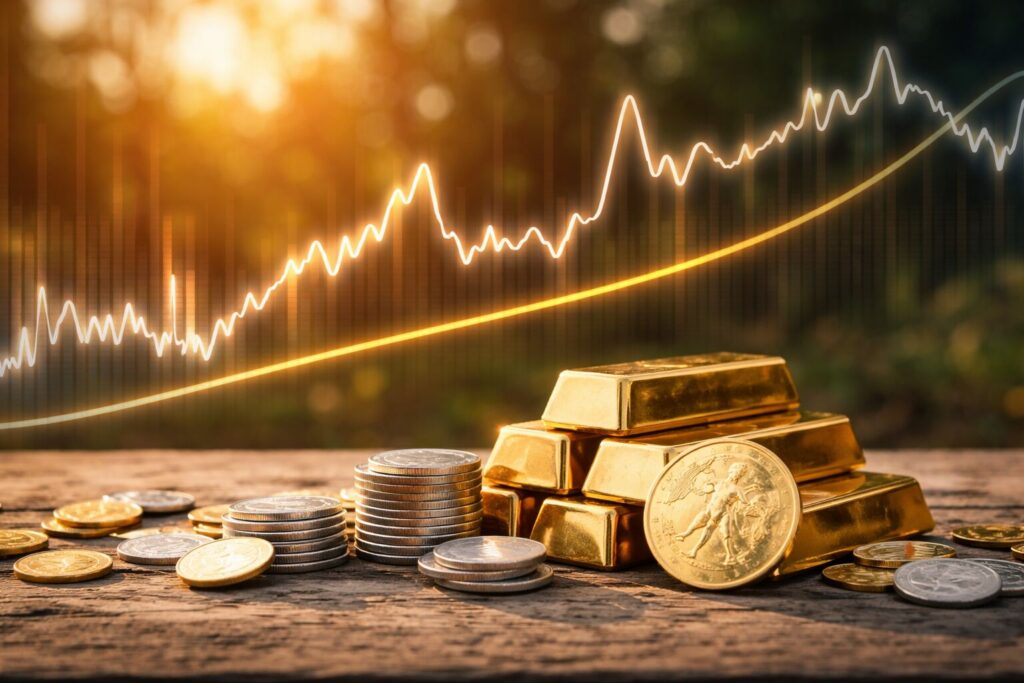
5 Key Drivers Behind the Gold & Silver Price Rally
Precious metals have taken center stage in global markets, with gold recently surpassing $4,100 per ounce and silver climbing above $51, marking their highest levels on record. This surge has captured investor attention worldwide, underscoring the renewed demand for tangible assets amid rising economic uncertainty. Understanding what’s fueling this gold and silver price rally is essential for investors seeking to navigate a volatile world. From Federal Reserve policy shifts to the return of inflation and the rise of central bank demand, here are the five core forces propelling gold and silver higher in 2025 — and why they matter for […]
Silver Breaks $50 for the First Time Since 1980
Discover the major silver price drivers behind silver’s surge past $50 and gold’s climb toward $4,000 — and what it means for investors today.
