Silver broke a historic record. The bigger signal isn’t the price.

Silver’s price is getting all the attention. But COMEX inventory drawdowns, a historic 10-month closing streak, and a Bank of America forecast ranging from $135 to $309 suggest the bigger story is happening beneath the surface.
The 1970s Gold & Silver Bull Run: Causes, Returns, and Lessons for Investors
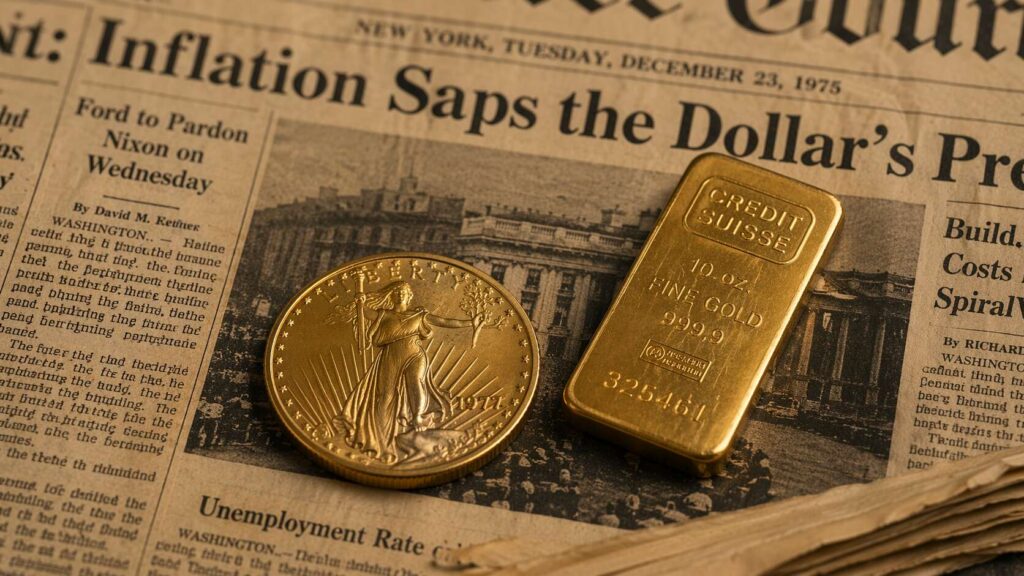
The 1970s gold and silver bull run remains one of the most dramatic wealth events of the 20th century. Gold rose 2,300%. Silver gained 400% in a single year. Understanding what drove that decade-long move — and what finally ended it — gives modern investors a precise framework for reading today’s precious metals market.
Silver’s Bull Run Didn’t Break — The CME Did

Silver’s rally didn’t break — the CME did. As trading halted across major markets, silver kept surging, breaking out above prior highs despite margin hikes. With confidence in fiat eroding and price signals returning, this move mirrors the explosive setup of the late 1970s. Silver may be leading the next major monetary shift.
Silver Just Did Something It Hasn’t Done Since 2011

Yesterday marked a significant milestone for precious metals investors: silver closed above $37.12, a level not seen since 2011. This breakthrough represents more than just another number — it’s the confirmation of a major technical breakout that Mike Maloney predicted months ago. The “Slingshot Move” Unfolds Back when silver was trading in the $33 range, Mike Maloney identified what he called a “slingshot move” pattern forming in the charts. His analysis suggested that once silver broke through key resistance levels, it would accelerate rapidly through multiple price points. That’s exactly what we’ve witnessed. In recent weeks, silver has: Why $37.12 […]
