 Silver Rises Over 120% YTD




Iran Fired Missiles. Oil Spiked 6%. Gold Fell. The Three-Step Chain Behind the Move.
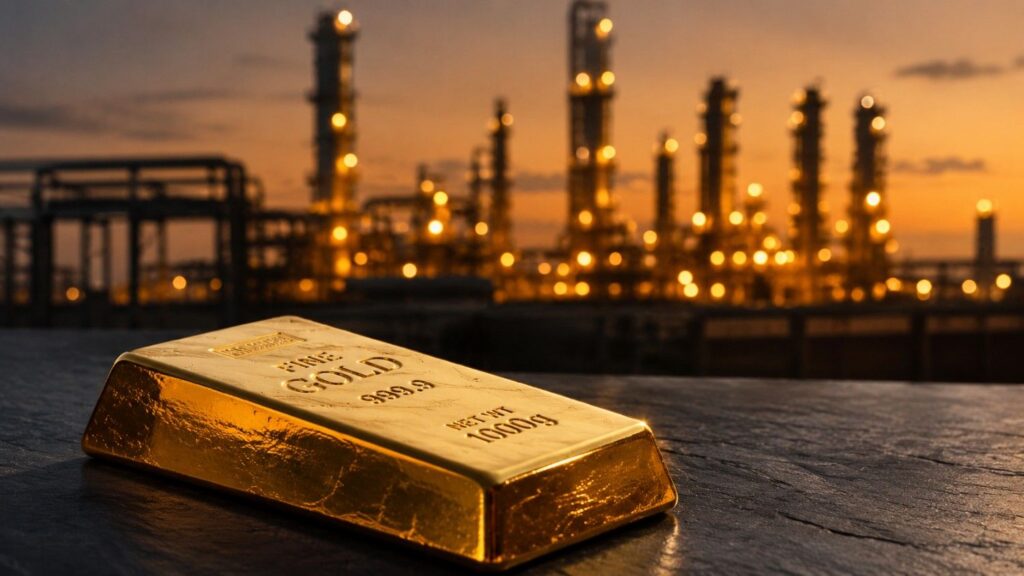
Iran’s Revolutionary Guard fired ballistic missiles at US forces overnight. All were intercepted. Oil surged more than 6 percent. Gold fell. Here is the exact three-step mechanism behind the counter-intuitive move — and why the structural case for physical metal is unchanged.
Oil Dropped 7%. Gold Rose. Here Is the Mechanism Everyone Misses.
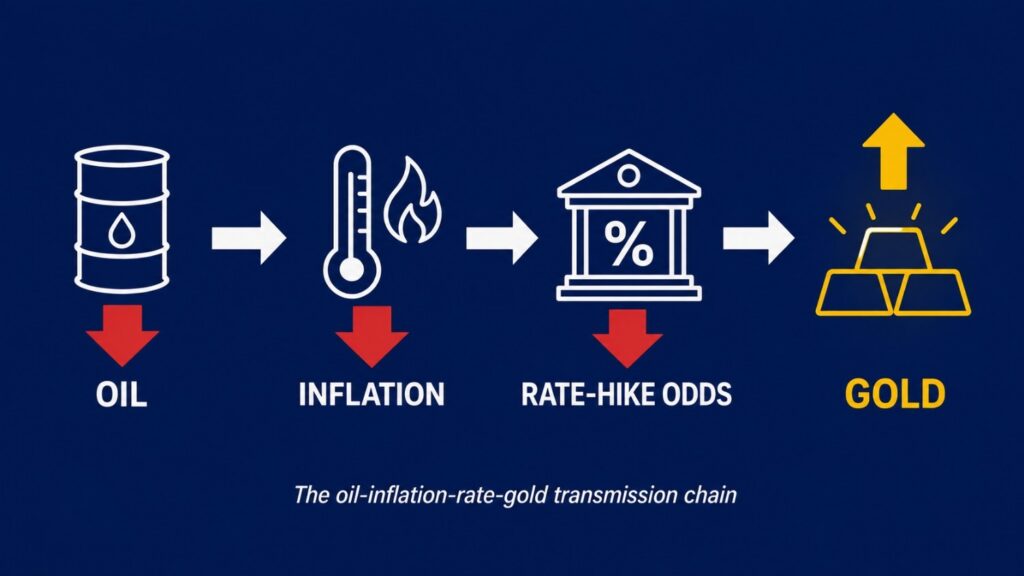
Oil dropped 7% on Monday after the US and Iran paused their 13-night exchange of strikes. Gold rose. Most headlines reported the move. Here is the mechanism that explains it — and why the same chain caused gold to fall during the conflict in the first place.
Kiyosaki Gold Prediction: Buy the Dip or Wait?
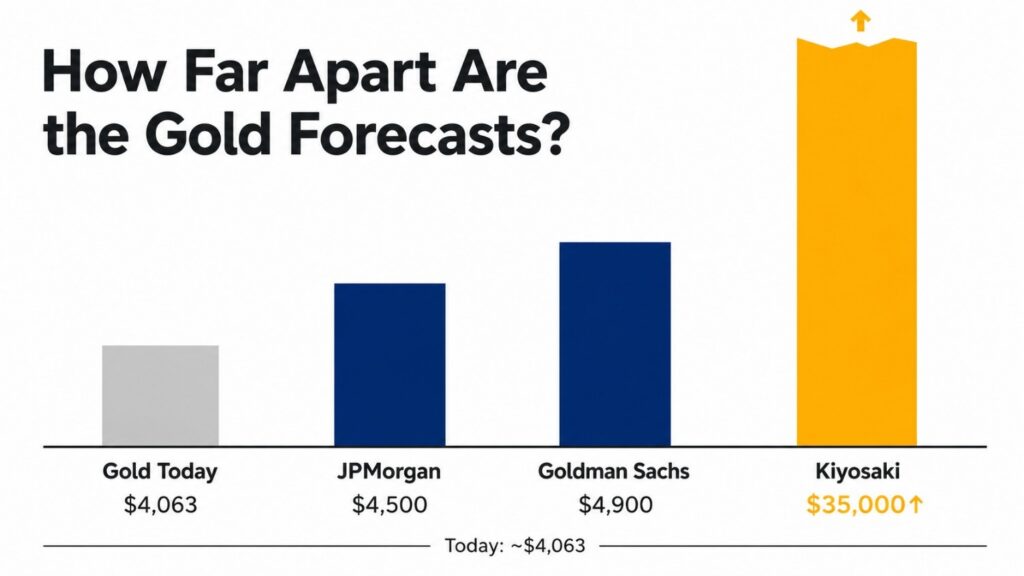
Robert Kiyosaki predicts $35,000 gold after a systemic collapse. Goldman Sachs targets $4,900. JPMorgan targets $4,500. Gold trades at $4,063 today — 27% below its all-time high. Here’s what the structural data says about buying the dip or waiting.
Oil Spiked 7% Yesterday. Silver Sold Off. Today Physical Buyers Are Doing Something Different.
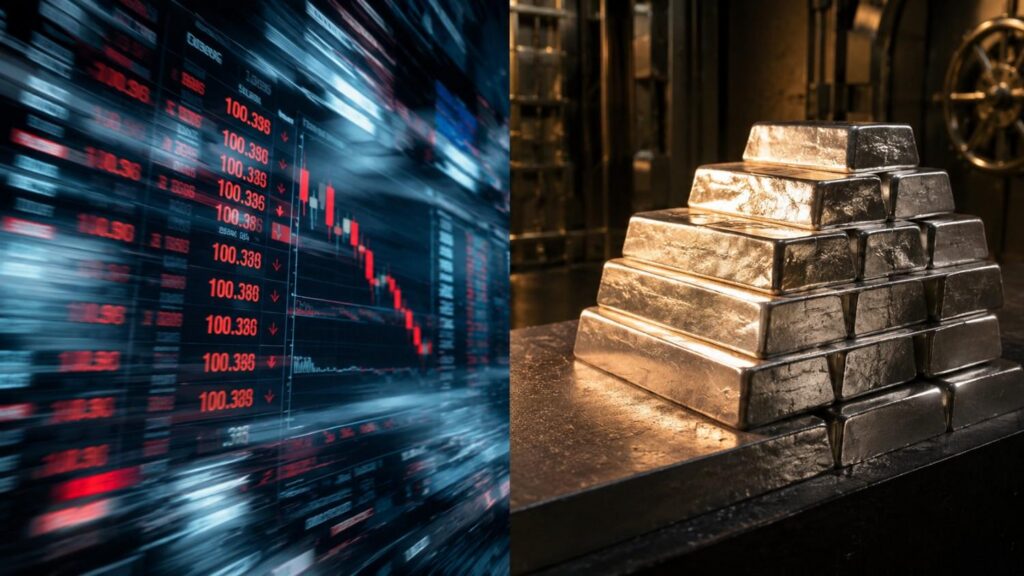
Silver recovered on Friday, July 24, 2026, after falling roughly 3% the prior session when Brent crude surged 7% above $100. Brent retreated below $100 on Friday as physical buyers stepped back in ahead of the July FOMC meeting. Here is the mechanism — and what the paper-vs-physical divergence tells you about where silver goes next.
Gold Is Down 26%. Silver Is Down 51%. What Does the Stacker Do Now?
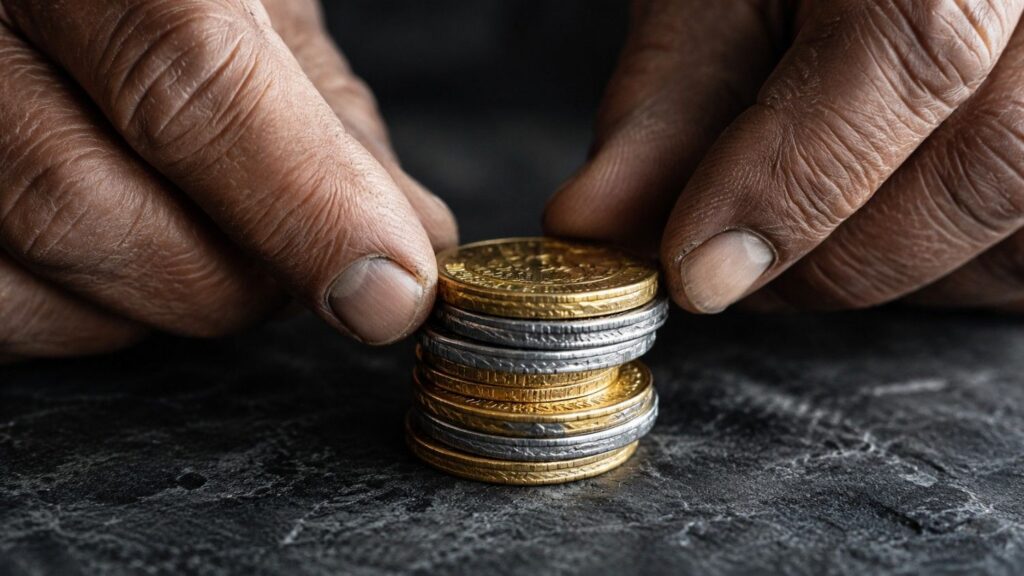
Gold and silver have pulled back sharply from their January 2026 peaks. The structural case — six consecutive silver deficits, 863 tonnes of central bank gold buying, and a gold-silver ratio above its long-run average — has not changed. This guide covers the floor thesis, how to read the GSR as a strategic compass, and how dollar-cost averaging turns volatility into an advantage.
Gold & Silver Market Correction: Is the 2026 Bull Market Over?
Gold fell nearly 28% from its January 2026 all-time high. Silver dropped over 52%. Here is what caused the correction, why the structural bull case remains intact, and what central banks, the WGC, and institutional forecasters say about where gold and silver go from here.
Silver Is Up Nearly 5% This Morning. Here Is Exactly Why.
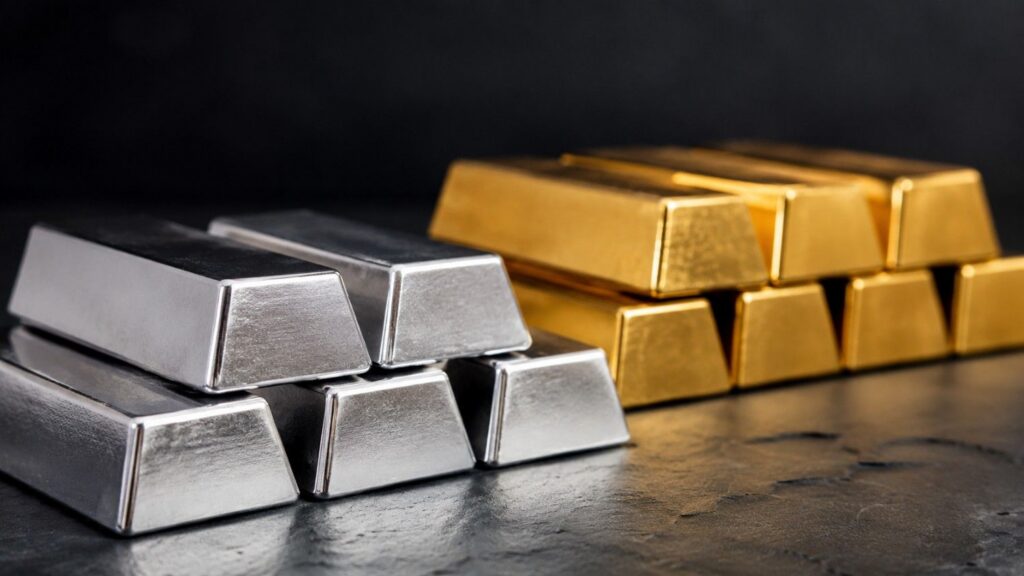
Silver is up nearly 5% this morning as mediators proposed a 10-day ceasefire between the US and Iran — and the mechanism behind the move is specific, teachable, and worth understanding before the next one. Here is the full chain: from oil prices to inflation expectations to the Federal Reserve’s September meeting, and what it means for long-term holders.
Why HSBC Still Believes Gold Hits $4,750 by Year-End (And What the Mainstream Is Missing)
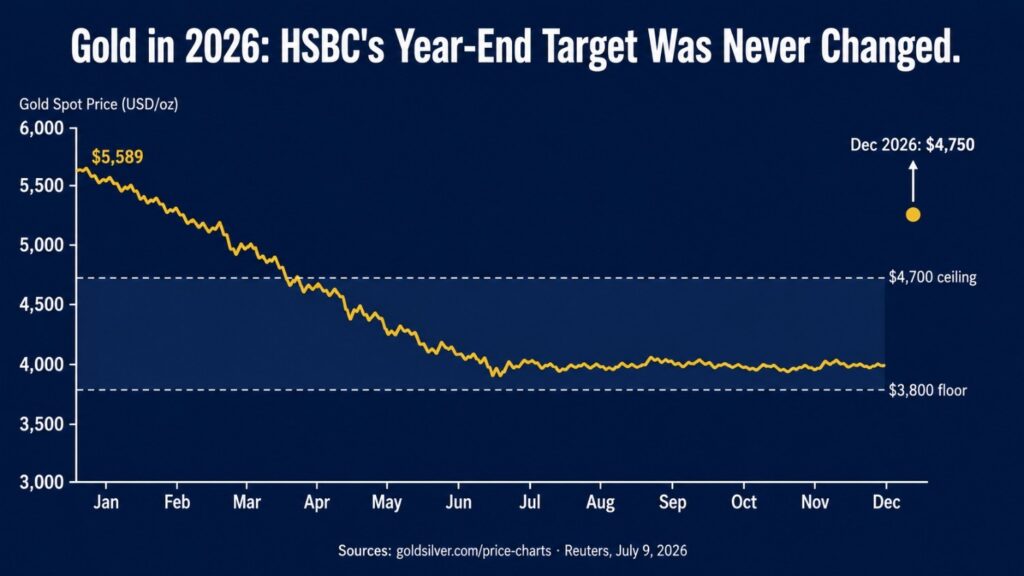
HSBC cut its 2026 average gold forecast by $304 on July 9. It left its year-end target at $4,750 unchanged. That gap between the two numbers is what the mainstream missed — and it tells you everything about where gold goes from here.
Silver Is Up 1.5% Today. Oil Is Up 3%. Those Two Moves Shouldn’t Coexist. Here’s Why They Do.
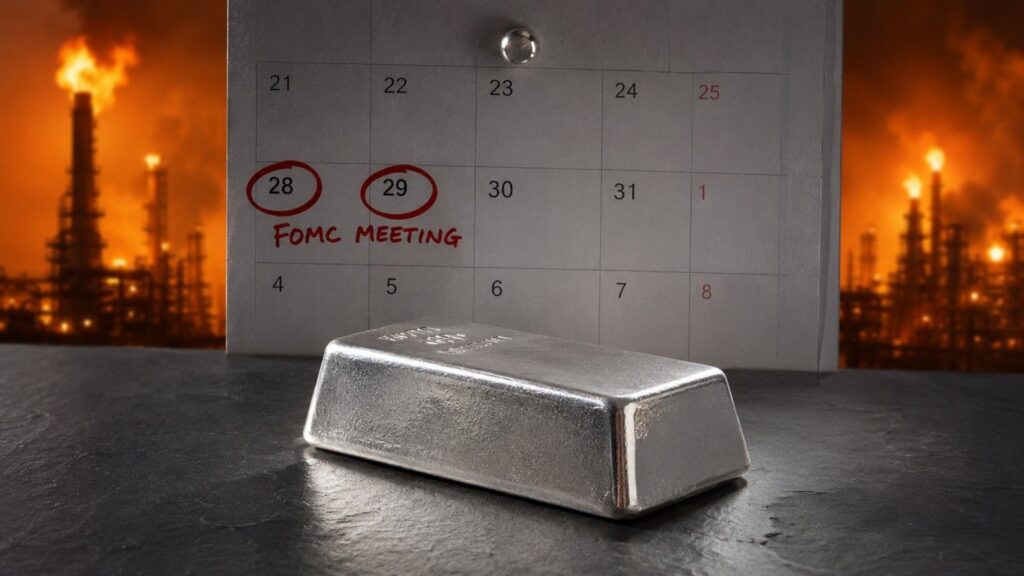
Silver rose 1.55% today even as crude oil surged 3% on fresh U.S.-Iran airstrikes — the inverse of what the standard oil-inflation-hike chain predicts. The reason: the July 29 FOMC hold is already priced above 85%, neutralizing today’s oil move as a rate catalyst. Here is the exact mechanism behind the broken correlation.
State Street Predicts $5,500 Gold by Q1 2027: Is the Dip Over?
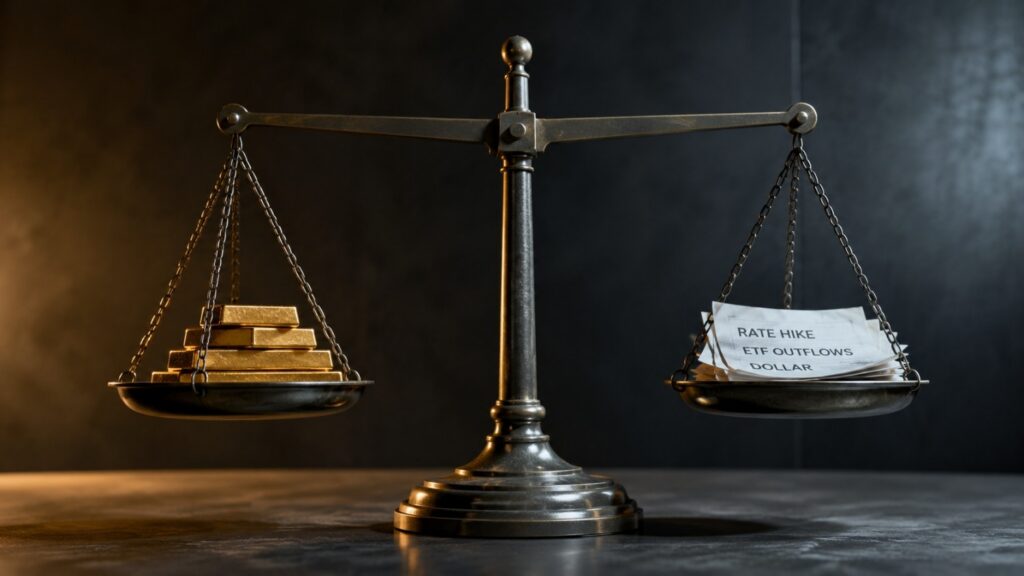
State Street’s July 2026 Monthly Gold Monitor targets $5,000 per ounce into early 2027, with a 70% probability baseline range of $4,750–$5,500. Here is the structural case behind the forecast — record global debt, central bank buying, and a stock-bond correlation breakdown — and what a gold recovery means for silver’s high-beta setup.


