Silver Rises Over 120% YTD




Published: 09-01-2026, 11:38 am
Gold slipped to $4,374 Tuesday morning, down 1.65%. Silver fell to $65.14, down 2.12%. Traders are pricing in a Fed rate hike this month. But look past today’s tape, and a different story emerges. Five separate signals out of Wall Street and Washington this week point the same direction: institutions are quietly betting on gold, even as today’s data argues against it. Here’s the common thread connecting a wobbling bond market, a surging ETF, a widening silver deficit, a hawkish options desk, and this morning’s jobs numbers.
Is Bessent’s Bond-Buyback Plan Already Losing Its Grip?
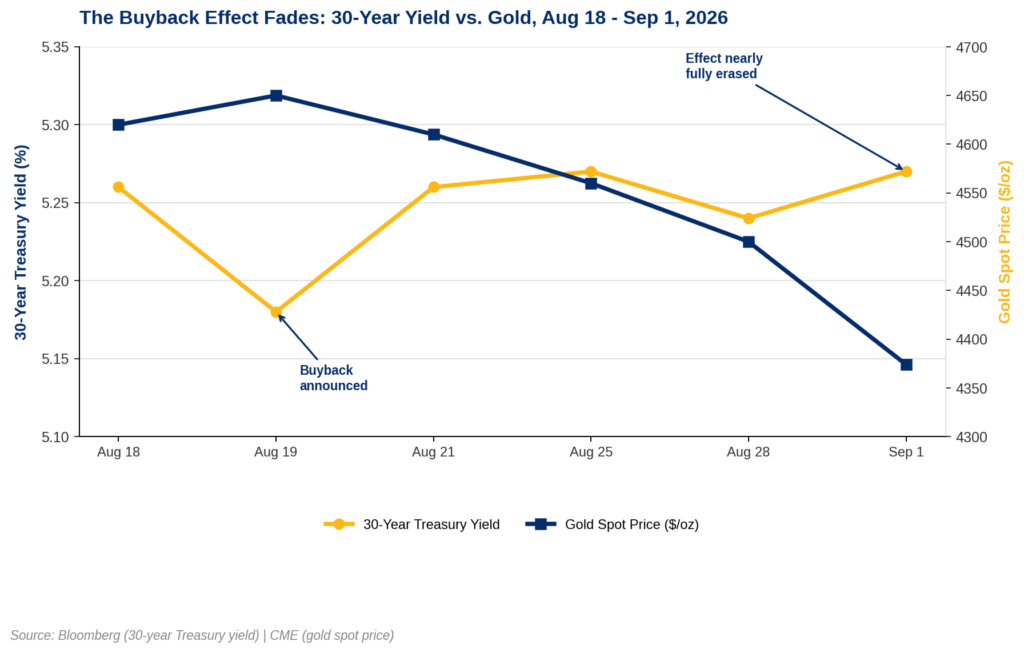
The 30-year Treasury yield climbed back to 5.27% on Tuesday, according to Bloomberg. That nearly erases the entire drop that followed Treasury Secretary Scott Bessent’s mid-August decision to double the size of the government’s long-bond buyback program, when the yield fell from 5.26% to as low as 5.18%. That program does not even start until September 9. The mechanism matters more than the headline. Treasury buybacks reduce the supply of long bonds hitting the market, which can pull yields down temporarily. What buybacks cannot do is shrink the deficit that keeps issuing new debt behind the scenes. Our earlier look at the buyback’s funding source found the same pattern: a liquidity tool dressed up as a rate-control tool. A fix this size reversed by the market in under three weeks, before it even launched, is not noise. That is the market pricing the underlying fiscal math, not the intervention.

The Edge Every Investor Needs Smarter precious metals investing starts here. The Nuggets Newsletter brings you essential market insights, Fed updates, global trends, educational videos, and much more.
Why Did Gold Funds Just Log Their Biggest Weekly Inflow in 10 Months?
Bank of America’s latest fund-flow data tell a clear story. Gold-backed ETFs added $6.4 billion in holdings during a single week in August. That is the largest one-week gain in roughly ten months, and the strongest since October 2025. BofA strategist Michael Hartnett has continued to flag gold as insurance against dollar weakness and currency debasement. Crucially, the bank’s data show this was not an isolated spike. The four-week moving average of flows is rising too, which means the buying is broad-based, not one large investor’s single trade. Institutional money tends to move ahead of retail sentiment. So when flow data turns before the headlines do, that is usually the more reliable signal.
Can the Silver Deficit Widen Even as Solar Demand Falls 19%?
Yes, and that is exactly what is happening. The Silver Institute now projects a global silver deficit of 46.3 million ounces for 2026, wider than 2025’s shortfall of 40.3 million ounces, even as solar-panel manufacturers cut silver use by close to 19% this year. Companies including LONGi, Jinko, and Aiko are shifting toward copper-based contacts to use less silver per panel. Here is why the deficit still grows anyway: mine supply is shrinking faster than demand is falling. Roughly three-quarters of the world’s silver comes as a byproduct of mining other metals, so miners cannot simply ramp up production when silver prices rise. Silver was also added to the US critical minerals list in late 2025, and a White House tariff review due back by mid-July has not produced a public resolution, underscoring how supply-constrained this market already looks to policymakers. Our allocated-versus-ETF silver piece covers the ownership side of that same squeeze.
Is Goldman’s Own Options Desk Betting Against a Selloff?
According to Goldman Sachs derivatives strategist Brian Garrett, the options market looks unusually one-sided right now. Demand for gold call options is high. Meanwhile, almost nobody wants downside protection through puts. Garrett reads Fed Chair Kevin Warsh’s Jackson Hole message as hawkish. Yet Goldman’s own house view still expects the Fed to hold rates rather than hike. Even so, Garrett’s recommendation is to stay long gold. He favors option structures built to avoid overpaying for that increasingly expensive call skew, rather than backing off the position. This is a specific and useful signal. A derivatives desk making that call, on the same trading floor whose economists expect no September hike, means even a bank’s own risk-takers see more upside than downside in gold from here.
What Do This Morning’s ISM and JOLTS Numbers Really Show?
The Institute for Supply Management reported Tuesday that its Manufacturing PMI slipped to 54.6% in August, down from July’s 55.6%. Meanwhile, its New Orders Index dropped three points to 53.7%. The Bureau of Labor Statistics reported the same morning that job openings fell to 7.271 million in July. That is below the 7.3 million economists expected, and down from June’s 7.359 million. Both readings point toward a labor market and factory sector that are cooling, gradually, not collapsing. Yet CME FedWatch data still show roughly two-thirds odds of a September rate hike, up sharply from about 40% a week ago. In other words, the data are softening while the rate-hike odds are rising. That gap, between what the numbers actually show and what markets are pricing, is exactly what the Fed will have to explain at its September 15-16 meeting, less than two weeks from today.
Why Does This Matter for What You Own?
No single signal here is loud enough to move gold’s live price alone. Together, though, they describe a system under strain. The government’s fiscal-repair tools wear off in weeks. Real institutions are adding gold at the fastest pace in nearly a year. And the desks paid to price risk lean toward more upside than downside. Together, that is the structural case for owning gold and silver. It is not one crisis, but a system where every fix costs something else. Physical metal outside that system holds its value, regardless of which fix Washington tries next. Watch September 9, when the doubled buyback program launches. Then watch September 15-16, when the Fed has to reconcile cooling data with rising hike odds.
Stay On Top of Gold & Silver Prices
Get important market alerts sent straight to your inbox.
SOURCES
1. Bloomberg — 30-year Treasury yield reporting, September 1, 2026 — bloomberg.com
2. Bank of America (Michael Hartnett) — gold ETF fund-flow research note, August 31, 2026, via GuruFocus/TradingView — tradingview.com
3. The Silver Institute — 2026 World Silver Survey deficit projection (46.3Moz), cited via market reporting, September 1, 2026 — ad-hoc-news.de
4. Goldman Sachs (Brian Garrett) — derivatives positioning commentary, August 31, 2026, via The Dark Side of the Boom — thedarksideoftheboom.substack.com
5. Institute for Supply Management — Manufacturing PMI Report, August 2026, released September 1, 2026 — prnewswire.com
6. US Bureau of Labor Statistics — Job Openings and Labor Turnover Survey, July 2026, released September 1, 2026 — bls.gov
7. CME FedWatch Tool — September 2026 rate-hike probability, via aggregated market reporting — fxstreet.com
Disclaimer: This article is for informational purposes only and does not constitute investment advice. Past performance is not indicative of future results. Always consult a qualified financial advisor before making investment decisions.
You May Also Like:
- Iran’s Gold Sector Just Got Named in U.S. Sanctions. Gold Is Selling Off Anyway.
- Hike Odds Doubled This Week. Real Yields Didn’t.
- COMEX Registered Gold Just Fell Below 15 Million Ounces. It’s Still Refilling.
- Gold Isn’t Falling on a Hawkish Fed. Here’s Why.
- Gold and Silver Sink as Warsh Cites AI Boom to Justify More Fed Tightening
- Five Things Moved Gold and Silver This Week. Only One Was Kevin Warsh.
- The Treasury’s Next Move Isn’t a Rate Cut. It’s a $967 Billion Checking Account