 Silver Rises Over 120% YTD




Dow to Gold Ratio: 100 Years of History Decoded
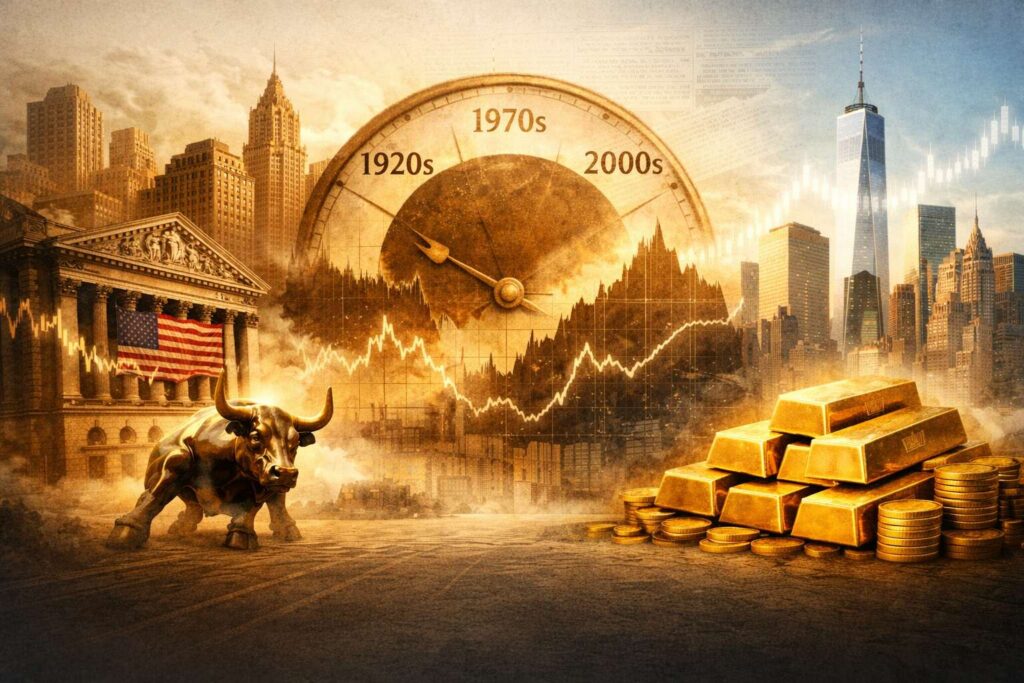
Gold has gained roughly 15.6% since January 1, 2026, while the Dow is up just 2.7% over the same stretch. That gap doesn’t register in most financial headlines — but the Dow to gold ratio captures it with precision. Right now, the ratio reads approximately 10: it takes around 10 ounces of gold to match one unit of the Dow index. At the dot-com peak in 1999, it took 43. What does that shift tell us, and where does it go from here?
The Fed Goes Silent in 3 Days – What Does That Mean For Gold?
The Fed goes silent April 18. For 12 days, no official can speak on rates — just as the Iran ceasefire teeters and stagflation data lands. Here’s what the FOMC blackout means for gold.
Why Do Investors Buy Silver Too Late — And What Does It Cost?

Every silver bull market follows the same pattern: thin buying interest at low prices, surging attention near the top. Understanding why that happens — and what it costs — is the difference between building wealth and chasing it.
How the 50 Day SMA Helps You Understand Gold & Silver
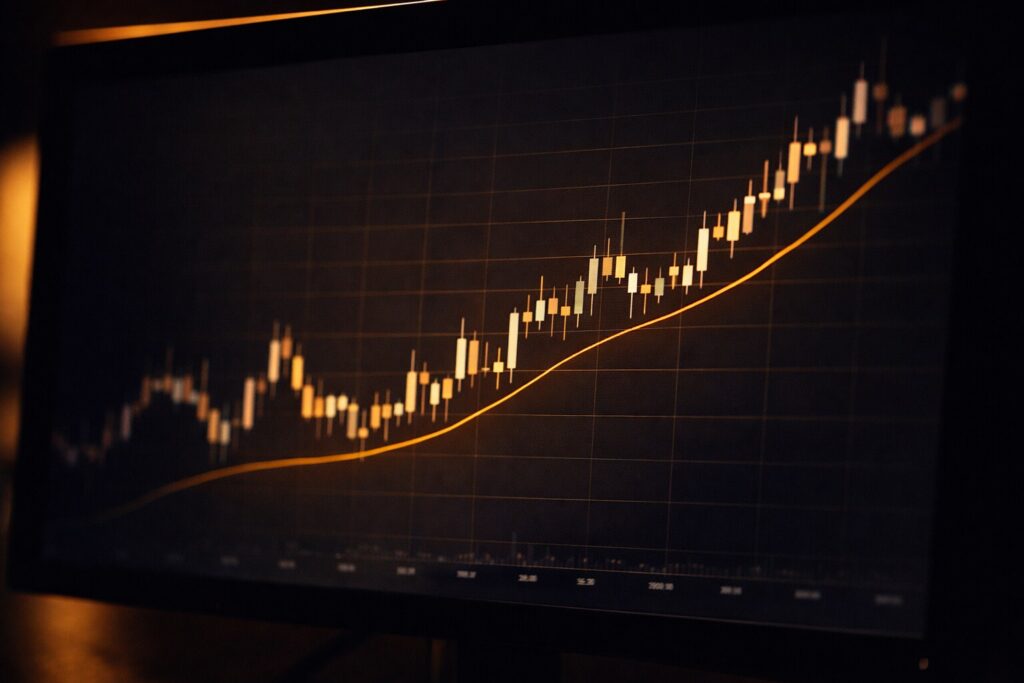
The 50-day SMA is one of the most reliable tools for reading gold and silver price trends. Learn how to use it to identify support levels, spot momentum shifts, and make more confident precious metals investment decisions.
Gold Is Down 10% From Its War-Peak — and Still Up 46% in a Year
Gold is down 10% from its war-peak — but up 46% in a year. The March PPI just hit 4.0%, the hottest since the conflict began. The headlines are telling the wrong story.


