Published: 04-14-2026, 10:21 am | Updated: 04-14-2026, 02:50 pm
This morning the Bureau of Labor Statistics released the Producer Price Index for March 2026 — the first wholesale inflation read since the U.S. Naval blockade of Iranian oil through the Strait of Hormuz. The number: final demand up 4.0% year-over-year, the hottest annual producer inflation since the war began. The inflation pipeline is still filling up.
Gold is trading around $4,761. That gap between the headline — “gold is falling” — and the reality is worth sitting with. So is the confusion driving it.
Why is gold falling when inflation is rising?
Rising inflation strengthens the dollar and pushes rate-cut expectations further out — both headwinds for a non-yielding asset like gold. So, the price pulls back in the short term. But that same inflation quietly destroys the purchasing power of savings over the long term, which is the whole reason people own gold. The short-term pressure and the long-term case aren’t contradictory. They just run on different clocks.
What Does the PPI Actually Tell Us?
PPI measures what businesses pay before consumers pay. When producer costs spike, companies absorb the hit briefly — then pass it along. The 21.2% gasoline surge that drove March’s CPI to 3.3% didn’t appear from nowhere; it moved through the producer level first. Today’s PPI is the pipeline reading.
March final demand rose 0.5% for the month and 4.0% year-over-year, up from 3.4% in February. Goods prices surged 1.6% — the energy pass-through is confirmed. The one piece of genuine good news: services were flat. Inflation is still concentrated in energy, not yet bleeding into the broader service economy. For now.
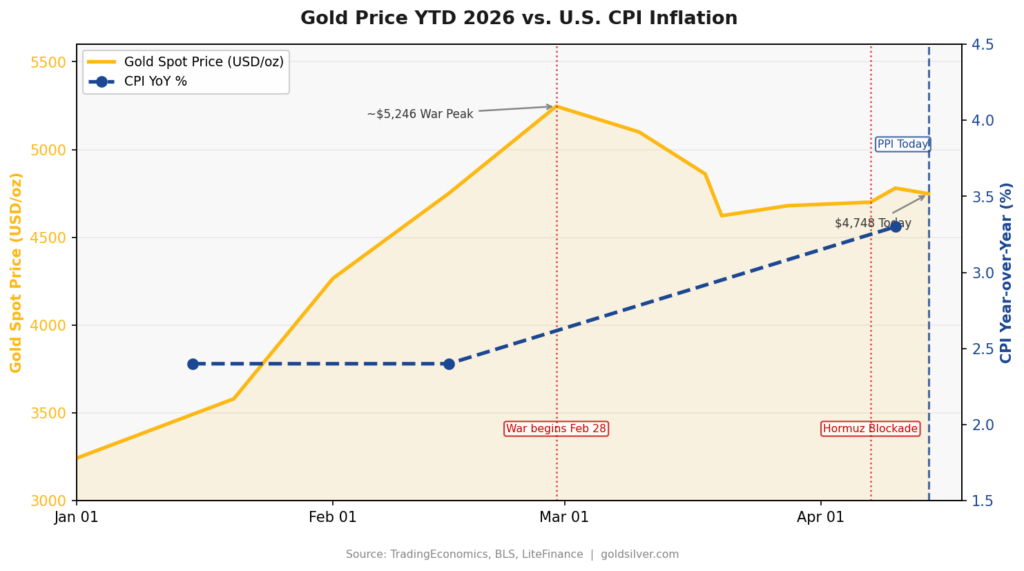
Gold surged ~60% from January to its war-peak before pulling back ~10% as ceasefire hopes and dollar strength weighed. CPI meanwhile jumped from 2.4% to 3.3% in March.
LPL Financial’s chief economist expects “another one or two hot inflation prints” ahead, driven by transportation services and durable goods as energy costs filter through supply chains. EY-Parthenon puts April-May CPI at 3.6% before easing — assuming the ceasefire holds.
Is the Gold Correction a Bear Signal or a Buy Signal?
Gold at $4,761 is down from its $5,300 war-peak. That’s the headline. Here’s the context: the money leaving gold right now was never committed to it.
SP Angel analyst Arthur Parish described it plainly in March — the tourists have arrived and are now leaving. Momentum traders and generalist funds piled in during gold’s 2025 surge. They’re not gold investors; they’re performance chasers. When the trade gets choppy, they exit.
The structural buyers haven’t moved. Five consecutive years of above-target inflation have permanently eroded the purchasing power of dollar savings — a dollar saved in 2021 buys roughly 18-20% less today. No rate hold reverses that. The wealth transfer from savers to debtors already happened. Gold held that value. Paper didn’t.

The Edge Every Investor Needs Smarter precious metals investing starts here. The Nuggets Newsletter brings you essential market insights, Fed updates, global trends, educational videos, and much more.
Are Central Banks Still Buying?
Yes. In January 2026, global central banks added 5 tonnes — below 2025’s 27-tonne monthly average, but the buyer list is growing. Malaysia and South Korea resumed purchases after long gaps. China kept accumulating. Uzbekistan was the largest single buyer.
Sovereign buyers don’t chase momentum. They buy because the post-2022 world changed the math. When Western nations froze Russian dollar reserves overnight, every non-aligned central bank received the same message: dollar-denominated assets are conditional. Gold in your own vault isn’t. That calculus hasn’t changed.
What Happens at the April 29 Fed Meeting?
Nothing. Markets price a 98.4% probability of no change. With producer inflation running at 4.0% annually, the Fed cannot credibly cut rates. But hiking risks tipping a war-stressed economy into recession. Powell’s final weeks as chair will be spent holding a policy rate that satisfies no one — too high for growth, too low to crush inflation.
That’s not a stable equilibrium. It’s a slow-motion pressure build, and gold prices it over months, not days.
The Bottom Line
Gold at $4,761 is not a broken thesis. It’s a shakeout — the kind that clears speculative positioning before the next structural move. The 4.0% annual PPI print today didn’t weaken the case for sound money. It confirmed it.
The tourists are leaving. The patient money is watching.
Stay On Top of Gold & Silver Prices
Get important market alerts sent straight to your inbox.
SOURCES
1. TradingEconomics — Gold Price, April 14, 2026
2. APMEX — Gold Price Today
3. U.S. Bureau of Labor Statistics — Consumer Price Index, March 2026
4. CNBC — CPI Inflation Report March 2026: Consumer Prices Rose 3.3%
5. CNBC — Here’s the Inflation Breakdown for March 2026
6. U.S. Bureau of Labor Statistics — Producer Price Index, March 2026
7. U.S. Bureau of Labor Statistics — Producer Price Indexes, February 2026
8. CNBC — Fed Interest Rate Decision March 2026: Holds Rates Steady
9. Morningstar — March CPI Forecast to Reflect Surge in Energy Prices from Iran War
10. Fox Business — March 2026 CPI: US Inflation Surged as Iran War Took a Toll on Consumer Prices
11. Briefs.co — Gold Just Had Its Worst Week in Over a Decade
12. World Gold Council — Central Bank Gold Statistics: Momentum Eases in January While Demand Base Broadens
13. Wikipedia — Economic Impact of the 2026 Iran War
This article is for informational purposes only and does not constitute financial or investment advice. Always consult a qualified financial advisor before making investment decisions.
You May Also Like
- Gold Outranks the Dollar at Central Banks — What It Means for Your Savings
- Hormuz Blockade Sent Gold Down 2%. Here’s Why That’s Bullish
- Gold Jumps 2% as Trump Plans Iran War Address Tonight
- $88 Billion a Month: Why U.S. Debt Is Driving Gold Prices
- CPI Hits 3.3%, GDP Stalls — Is Stagflation 2026 Here?
- War Risk, Stagflation Signals, and a $6,300 Gold Target
- Gold and Oil Brace for the Strait of Hormuz Deadline