Silver Rises Over 120% YTD




Published: 09-29-2026, 03:28 pm
A Nomura strategist just told Bloomberg the US economy has room to absorb more Federal Reserve rate hikes than the market is pricing in. That is not a Fed announcement. It is a bet on where real interest rates go next. Real yields are the one lever that moves gold’s price more reliably than any headline. This week, that lever already moved: the real 10-year Treasury yield climbed from 2.62% to 2.83% in four trading sessions.
Here is what that means for gold’s price ceiling, and what it does not mean.
Key Takeaways:
- Nomura’s North Asia CIO told Bloomberg (Sept 28, 2026) the US economy can absorb more Fed rate hikes without a recession, citing consumer spending, AI capex, and loose fiscal policy.
- The real 10-year Treasury yield rose from 2.62% to 2.83% between September 21 and 25, 2026. A longer Fed hiking cycle would keep pushing that number higher.
- CFTC data for the week ending September 22, 2026 showed COMEX gold speculative positioning at 61.5% net-long. That crowded book can amplify a pullback on any hawkish surprise.
- Goldman Sachs’ year-end 2026 gold target is $4,900. J.P. Morgan’s is roughly $6,000. Both sit above the $4,165 spot price.
- A hawkish Fed is a headwind on gold’s near-term path through real yields. It is not evidence against the structural, multi-year case for owning the metal.
Why Does the Bank Call Matter More Than the Headline?
That is not a data release. It is a house view about how much further the Fed can push. And it matters to anyone holding gold, for a reason that has nothing to do with headlines. It is a call about the future path of real interest rates. Real interest rates are the single mechanism that moves gold most reliably.
This piece is not here to tell you whether Wang is right. It is here to walk through what a longer hiking cycle would do to gold’s price ceiling if she is right. Even if that outcome arrives, it does not settle the larger argument for owning the metal.
What Is a Real Yield, and Why Does Gold Care?
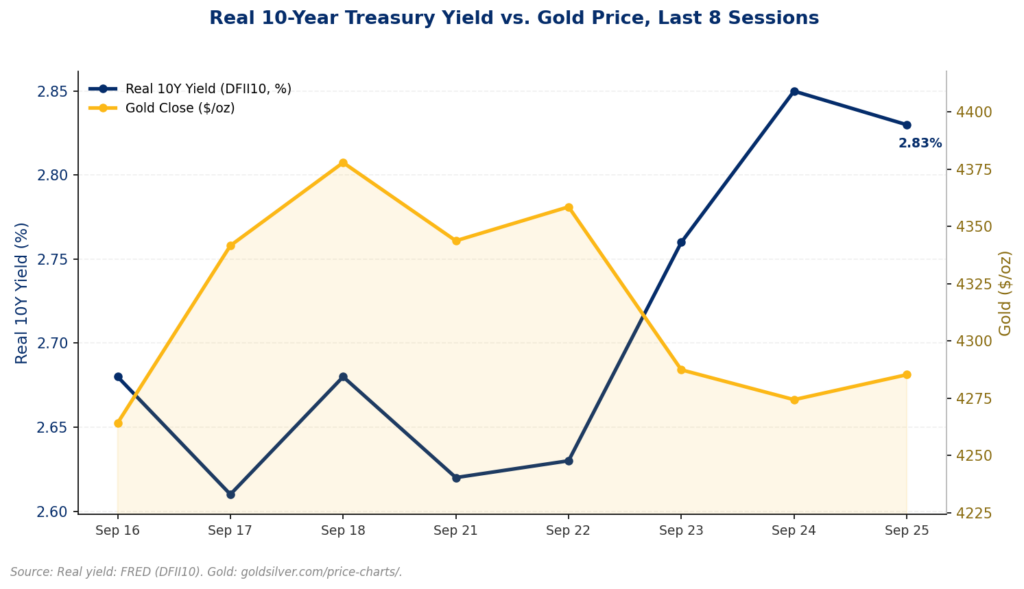
Gold pays no interest, no dividend. Own an ounce and a decade from now you still have one ounce. So the honest comparison for a gold investor is not gold versus cash. It is gold versus a 10-year Treasury, adjusted for what inflation eats out of that Treasury’s return. That adjusted number is the real yield, and the market prices it every day through Treasury Inflation-Protected Securities. (For a deeper walk-through of this mechanism, see GoldSilver’s explainer on real yields vs. nominal rates.)
On September 25, 2026, the real 10-year yield stood at 2.83%. Four trading sessions earlier, on September 21, it was 2.62%. That is a 21 basis-point move in less than a week. It is consistent with the Fed’s most recent hike still working through the bond market. Historically, a quarter-point move in real yields corresponds to roughly a $40 to $60 per ounce move in gold, in the opposite direction. Real yields up, gold down, all else equal.
Here is the second corner most coverage of a rate story skips. The event everyone is watching is the Fed meeting, the dot plot, the press conference. But the event that actually moves gold’s price is what real yields do afterward. That can keep moving for days or weeks after the headline fades. If Wang’s thesis is correct, the Fed genuinely has room for more hikes. The honest expectation, then, is that real yields keep grinding higher rather than topping out here. That is the mechanism. It is not a prediction about a single number on a single day. It is a statement about which direction the wind is blowing.
Is Gold’s Long Positioning a Risk Right Now?
There is a second piece of this that rarely makes it into a rate-hike story. Who already owns gold, and how exposed is that group to being wrong?
The CFTC’s Commitment of Traders report for the week ending September 22, 2026, told the story. Managed-money traders held 253,982 long contracts in COMEX gold against just 28,129 short. That works out to 61.5% of total open interest sitting on the long side of the ledger. It is among the more one-sided books this market has carried in the current cycle. A large speculative long position is not, by itself, a bearish signal. It reflects real conviction, built over a real bull run.
But a market already leaning heavily one direction has less cushion if the news flow turns against it. If the Fed hikes again and real yields keep climbing, crowded longs can get trimmed fast. That produces a sharper, faster pullback than the underlying macro shift would justify on its own.
That is a reason to expect more volatility around the next few Fed-related data points. It is not, on its own, a reason to expect a change in trend.
The Knowledge That Changes Everything

Two essential guides — yours free. Understand why gold matters and why fiat currencies always fail.
What the Street’s Own Money Says
Here is where the argument closes the loop. If the banks making the hawkish case were also turning bearish on gold’s destination, that would be a genuinely different story. They are not.
Goldman Sachs’ published year-end 2026 gold target is $4,900. J.P. Morgan’s is roughly $6,000, according to GoldSilver’s own recent round-up of every major bank’s 2026 gold forecast. Both figures sit well above the $4,165 gold was trading at as this was written. Both banks arrived at those numbers through the same institutions whose economists are debating how many more times the Fed can raise rates. Wells Fargo, Bank of America, UBS and Morgan Stanley all publish targets in a similar range, above spot. The shared foundation: continued central bank buying, plus Western institutional and pension portfolios that remain, by any historical measure, underallocated to gold.
That is the tension this article has been building toward. A bank’s own economists can genuinely believe the Fed has room to hike further. That same bank’s commodities desk can genuinely believe gold ends the year meaningfully higher than it sits today. Those two views are not in conflict. One is about the next few months of interest-rate mechanics. The other is about a multi-year reallocation of institutional and sovereign capital into a metal that most large pools of money still barely hold. A hawkish stretch can slow the first without touching the second.
What’s the Debt-Service Argument Nomura’s Wang Isn’t Making?
There is a separate case being made in public right now. Not by a bank economist, but by widely followed market commentary. It deserves a place here because it complicates the picture rather than simplifying it. The argument, in short: long-term Treasury yields last sat near current levels roughly two decades ago. Total US federal debt was a fraction of what it is today. It crossed $40 trillion for the first time in August 2026. Every additional percentage point in the government’s borrowing cost now carries a far larger dollar burden. The debt it applies to has grown several times over.
That argument is not about whether consumers or businesses can absorb higher rates. That is Wang’s question. This one is about whether the government’s own finances can tolerate a long stretch of high borrowing costs without consequence. Those are two different tests. An economy can plausibly pass the first while straining under the second. That tension is the more durable thing worth understanding. It matters more than any single week’s price move, especially for a reader watching a Fed that keeps hiking as the government’s own debt math gets less forgiving.
What’s the Takeaway for Gold Investors?
None of this requires picking a side in the debate over how many more times the Fed hikes. It requires understanding the mechanism well enough to know what a hawkish surprise actually does to gold, and what it does not do. A longer hiking cycle pushes real yields higher. Higher real yields are a genuine, mechanical headwind for a metal that pays no yield of its own. A crowded long position means that headwind can arrive as a sharper move than the macro shift alone would justify.
Neither fact is a verdict on the structural case for owning gold. That case rests on a different set of forces entirely. Those are the same forces the banks making the hawkish rate call are relying on to justify their own bullish price targets. You can track today’s gold and silver prices, along with the historical chart, on GoldSilver’s own price page. Own some. Understand why the price moves the way it does. The rest takes care of itself.
Stay On Top of Gold & Silver Prices
Get important market alerts sent straight to your inbox.
People Also Asked
What did Nomura say about the Fed and interest rates?
Nomura’s North Asia Chief Investment Officer, Julia Wang, told Bloomberg on September 28, 2026 that the US economy remains resilient enough to absorb more Fed rate hikes. In her view, the economy will not tip into recession. She pointed to strong consumer spending, ongoing AI-related capital expenditure, and loose fiscal policy as the supporting drivers. It is a house view, not a Fed announcement, but it argues for a longer hiking cycle than some in the market currently expect.
Why do rising interest rates hurt gold prices?
Gold pays no yield, so its main competitor is the real, inflation-adjusted return on a safe government bond like the 10-year Treasury. When the Fed raises rates and that real return climbs, holding gold instead becomes more expensive in opportunity-cost terms, and gold prices tend to soften. When real yields fall, that cost disappears and gold tends to firm. It is a mechanical relationship, not a mood.
What is a real yield?
A real yield is a bond’s return after subtracting expected inflation. The market prices it directly through Treasury Inflation-Protected Securities (TIPS). On September 25, 2026, the real 10-year yield stood at 2.83%, up from 2.62% just four trading sessions earlier. That move is consistent with the Fed’s most recent hike still working through the bond market.
Is gold overbought right now?
Positioning data suggests the market is unusually one-sided rather than technically overbought in a price sense. The CFTC’s Commitment of Traders report for the week ending September 22, 2026 showed COMEX gold speculative longs at 61.5% of total open interest. That level of one-sidedness can produce a sharper pullback if a hawkish surprise arrives, because crowded positions get trimmed quickly. It is not, on its own, a signal that gold’s price is too high.
What are Wall Street’s gold price targets for the end of 2026?
As of GoldSilver’s most recent forecast round-up, Goldman Sachs’ year-end 2026 target is $4,900 and J.P. Morgan’s is roughly $6,000. Wells Fargo, Bank of America, UBS, and Morgan Stanley all publish targets above the current $4,165 spot price. Bank targets shift over the year and are a snapshot, not a guarantee.
Does a hawkish Fed mean it’s a bad time to own gold?
A hawkish stretch is a real, mechanical headwind for gold’s near-term price path through the real-yield channel described above. It has not changed where the same institutions expect gold to be by year-end. A near-term price headwind and a change in the multi-year structural case are not the same question.
What is fiscal dominance, and how does it relate to this story?
Fiscal dominance describes a situation where a government’s own debt-service costs constrain central bank policy. Higher rates simply become too expensive for the government’s own budget to sustain. It is a different question from whether the broader economy can absorb higher rates, which is the question Nomura’s Wang addressed. An economy can plausibly tolerate higher rates even as the government’s own finances find them increasingly costly. That tension, not any single week’s price move, is worth watching.
SOURCES
1. Bloomberg – Nomura’s Wang: US Can Absorb More Rate Hikes – September 28, 2026
2. FRED – 10-Year Treasury Inflation-Indexed Security (DFII10) – September 25, 2026
3. CFTC – Commitment of Traders Report – Week Ending September 22, 2026
4. GoldSilver – Every Major Bank Cut Its 2026 Gold Forecast. Now They Almost Agree — Near $4,500 – September 8, 2026
5. GoldSilver – Real Yields vs. Nominal Rates: The Number That Actually Moves Gold – September 25, 2026
6. GoldSilver – The National Debt Hit $40 Trillion. Jefferies Just Turned Bullish on Gold. – August 21, 2026
7. GoldSilver – Price Charts – September 29, 2026
Disclaimer: This article is for informational purposes only and does not constitute investment advice. Past performance is not indicative of future results. Always consult a qualified financial advisor before making investment decisions.
You May Also Like:
- Gold Fell 23% This Year. One Number Explains Why.
- What Is the Debt-to-GDP Ratio, and What the US Number Tells You About Gold
- The World’s Last Zero-Rate Anchor Is Rising, and Gold Should Care
- What Is a FOMC Meeting? What the Fed Decides and How Gold Reacts
- Gold in Your Phone: How Much Gold Is in Electronics and What It Means for Demand
- Real Yields vs. Nominal Rates: The Number That Actually Moves Gold
- How to Read a Gold Spot Price Chart: The 4 Things That Actually Matter
- Central Banks Hold 80% of Reserves in Gold. Sovereign Wealth Funds Hold Under 1%.