Silver Rises Over 120% YTD




Published: 09-25-2026, 11:06 am
Gold fell to $4,304 on September 23, 2026. Silver dropped 3% to $65. Wire coverage blamed a hawkish Federal Reserve and a firming dollar, and named names. St. Louis Fed President Alberto Musalem and Chicago Fed President Austan Goolsbee both signaled that further rate hikes were likely needed, in public remarks that day. All of that is true. It’s also not the number that actually moved gold.
The number that mattered was the 10-year real yield, and it jumped 13 basis points that same day. If you don’t know how to find that number yourself, you’re reading gold’s most important signal secondhand, filtered through whichever headline a wire service ran. Here’s how to check it yourself, using the same data this desk pulls.
Key Takeaways:
- Gold’s strongest and most consistent macro driver is the real 10-year Treasury yield (DFII10), not the nominal yield or the Fed funds rate.
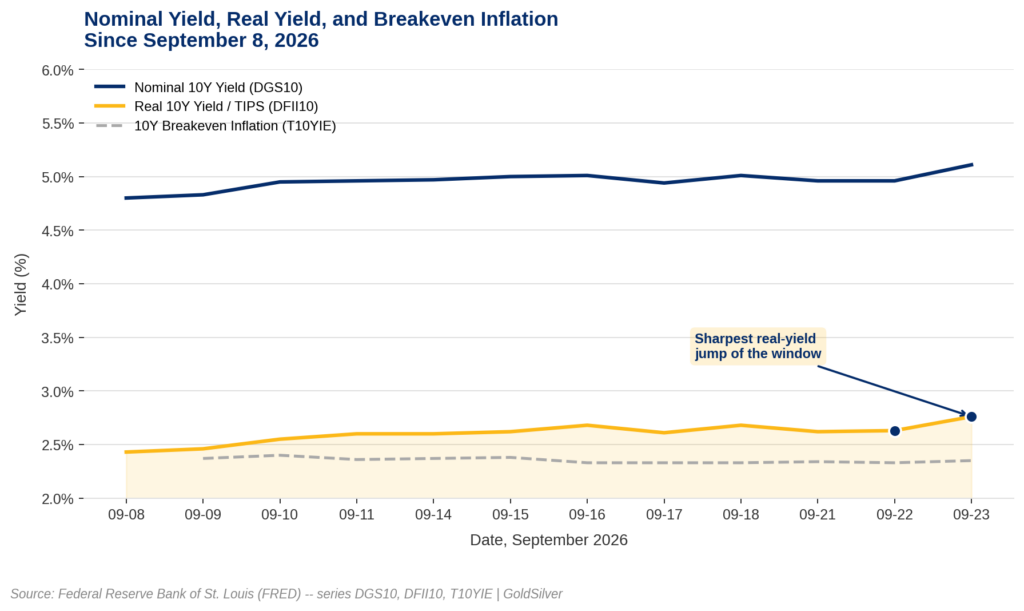
- Since September 8, 2026, nominal 10Y yields rose 31bps while real yields rose 33bps and breakeven inflation stayed flat. This month’s move is a real-rate story, not an inflation story.
- Real yields are currently positive (2.76%) and rising, a genuine headwind distinct from the negative-real-yield “financial repression” environment of 2020-2022.
- All three series (DGS10, DFII10, T10YIE) are free and public on FRED, updated daily. Any reader can run this check themselves.
What’s the Difference Between the Nominal and Real 10-Year Yield?
Most coverage glosses over a simple fact: there isn’t one 10-year Treasury yield. There are effectively two, and they answer different questions.
The nominal 10-year yield (FRED ticker DGS10) is the yield everyone quotes. It’s the interest rate on a standard 10-year Treasury bond. On September 23, it closed at 5.11%. That’s up 31 basis points from 4.80% on September 8.
The real 10-year yield (FRED ticker DFII10) is different. It’s the yield on Treasury Inflation-Protected Securities, bonds whose principal adjusts with inflation. What’s left over is compensation purely for lending money, with the inflation premium stripped out. On September 23, DFII10 closed at 2.76%, up 33 basis points from 2.43% on September 8.
The gap between the two, roughly 2.35 percentage points, is the market’s breakeven inflation rate (FRED ticker T10YIE). That’s what bond traders expect inflation to average over the next decade. Here’s the part that didn’t make the headlines: breakeven inflation barely moved this month. It drifted from 2.37% to 2.35%.
Do the arithmetic and something becomes obvious. Nominal yields rose 31 basis points. Real yields rose 33 basis points. Inflation expectations didn’t move. Virtually the entire rise in Treasury yields this month is a real-rate story, not an inflation story. Gold cares about exactly one of those two things.
Why Do Real Yields Move Gold More Than the Fed Funds Rate?
Gold pays no coupon, no dividend, no yield. Holding it costs you whatever a safe, interest-bearing alternative would have paid instead. That opportunity cost isn’t the nominal Treasury yield. It’s the real yield, because inflation erodes a bond’s coupon just as surely as it erodes a stack of cash under your mattress.
When real yields rise, the cost of holding a zero-yield asset like gold rises with it. Gold typically comes under pressure. When real yields fall, especially when they turn negative, so a “safe” bond guarantees you lose purchasing power, gold’s relative appeal rises sharply. That’s the mechanism. It’s a far more reliable predictor of gold’s direction than the Fed funds rate, the policy lever everyone watches instead.
The data this month makes the case cleanly. The sharpest real-yield jump in this window came between September 22 and September 23, the same session Musalem and Goolsbee made their hawkish remarks (Federal Reserve officials, September 23 public comments), when DFII10 climbed from 2.63% to 2.76% in a single day. That’s also the session when gold posted its sharpest one-day decline in recent weeks: a fall from $4,358.58 to $4,287.43, a 1.6% drop. One day isn’t proof of causation. But it’s consistent with the mechanism, and any reader can verify the same alignment the next time gold makes a sharp move.
The Knowledge That Changes Everything

Two essential guides — yours free. Understand why gold matters and why fiat currencies always fail.
Are We in a Negative or Positive Real-Yield Regime Right Now?
It’s worth being precise about which regime we’re actually in, because the sound money case sounds different depending on the answer. Real yields at 2.76% are solidly positive. This is not the negative-real-yield, financial-repression environment of 2020 to 2022, when savers were guaranteed to lose purchasing power by holding “safe” bonds. Gold’s case was easier to make back then. (For the negative-real-yield case in full, including the fifty-year pattern behind it, this desk covers that separately in What Are Negative Real Interest Rates, and Why Does Gold Thrive in This Environment?.)
Right now, real yields are positive and rising. That’s a genuine headwind. Gold holding up as well as it has this year despite that headwind is itself worth noting, not explaining away. The framework here is the general one: however the two numbers move, decomposing them tells you which force is actually at work, in any regime.
This exact mechanism showed up again just one week earlier. Silver round-tripped a 6.8% swing in nine days in mid-September. Most coverage credited fading inflation fear, but the Fed’s own data told a different story: breakevens actually fell over that window while real yields rose 22 basis points. Same mechanism. Same blind spot in the coverage. One week apart.
Why Is Social Media Still Blaming Inflation, Not Real Yields?
There’s a live gap between what the mechanism says and what the online conversation says. Social sentiment around gold (XAUUSD) currently runs about 89% positive. The single largest supportive theme in that chatter is “CPI-driven bullish momentum”: traders framing gold’s move around inflation data and a softening dollar. But the dollar hasn’t been softening this month. The trade-weighted dollar index has been climbing steadily since late August. The crowd is watching the wrong half of the equation. It’s an easy mistake to make when the two 10-year yields look, at a glance, like the same number.
How Can You Check Real Yields Yourself?
You don’t need a Bloomberg terminal for this. FRED, the Federal Reserve Bank of St. Louis’s public database, publishes all three series free, updated daily. Search DGS10 for the nominal 10-year yield. Then pull DFII10 for the real 10-year yield. Finally, check T10YIE for the 10-year breakeven inflation rate. Pull the last two to three weeks of each, and you can run this same decomposition on any gold move, without waiting for a wire service to pick the story for you.
The rule of thumb: if DFII10 and DGS10 move together while T10YIE sits still, it’s a real-rate story. That’s a gold headwind, or a tailwind if they’re falling. If T10YIE does the moving while DFII10 sits still, it’s an inflation-expectations story, and gold’s relationship to it is murkier and less reliable. Either way, you’ll know which fight you’re actually watching, instead of the one the headline picked for you.
Stay On Top of Gold & Silver Prices
Get important market alerts sent straight to your inbox.
People Also Asked
What is the difference between a real yield and a nominal yield?
A nominal yield is the interest rate printed on a bond. It carries no adjustment for inflation. A real yield strips inflation out. It measures the actual purchasing-power return a lender earns. On US Treasuries, the nominal 10-year yield is FRED series DGS10. The real 10-year yield is DFII10, the yield on Treasury Inflation-Protected Securities (TIPS). As of September 23, 2026, DGS10 sat at 5.11% and DFII10 at 2.76%. The roughly 2.35-point gap between them is the bond market’s breakeven inflation estimate, tracked as T10YIE.
Should investors watch real yields or nominal yields when following gold?
Real yields are the better gauge for gold, not nominal yields. Nominal yields blend two different signals: inflation expectations and the true cost of money. Only one of those, the real component, consistently moves gold. In September 2026, nominal 10-year yields rose 31 basis points. Real yields rose 33 basis points in the same window. Breakeven inflation stayed flat. The nominal number alone would have mischaracterized the month as an inflation story rather than a real-rate story.
How do I check real yields myself, step by step?
Go to fred.stlouisfed.org and search three tickers. Use DGS10 for the nominal 10-year yield. Pull DFII10 for the real 10-year yield. Check T10YIE for 10-year breakeven inflation. Pull the last two to three weeks of daily data for each. If DGS10 and DFII10 move together while T10YIE stays flat, real yields are driving the story. That’s typically a gold headwind when rising. If T10YIE does the moving instead, it’s an inflation-expectations story. Its relationship with gold is weaker and less consistent.
What happens to gold if real yields keep rising?
Rising real yields raise the opportunity cost of holding a zero-yield asset like gold. Historically, that’s a headwind, not a floor. A 25-basis-point move in real yields has historically corresponded to roughly a $40 to $60 per ounce move in gold. The relationship is directional, not mechanical. Other forces, like central bank buying, dollar moves, or geopolitical demand, can offset or amplify it in any given stretch. Real yields at 2.76% and climbing, as of September 23, 2026, is a genuine headwind gold is currently absorbing, not one it has been immune to.
What happens if breakeven inflation starts rising instead of real yields?
That would flip this into an inflation-expectations story rather than a real-rate story. Gold’s relationship to rising inflation expectations is historically supportive. But it is less immediate and less reliable than its relationship to real yields. Breakeven inflation (T10YIE) has been flat, drifting from 2.37% to 2.35% between September 8 and September 24, 2026. So this scenario has not been in play this month. The same three-ticker check would reveal it early. T10YIE moving while DFII10 holds steady is the signature to watch for.
Why does gold react to real yields instead of the Fed funds rate?
The Fed funds rate is a short-term policy lever the Federal Reserve sets directly. It affects gold only indirectly, by influencing the real yield on longer-dated bonds. That real yield is what actually sets the opportunity cost of holding a zero-yield asset like gold. A Fed rate decision alone does not reliably predict gold’s move. The market’s real 10-year yield, not the fed funds rate, is the operative variable. The two can diverge, as the September 22-23, 2026 window showed, when a sharp real-yield jump lined up with gold’s sharpest single-day drop of the period.
SOURCES
1. Federal Reserve Bank of St. Louis (FRED) – 10-Year Treasury Constant Maturity Rate (DGS10)
2. Federal Reserve Bank of St. Louis (FRED) – 10-Year Treasury Inflation-Indexed Security, Constant Maturity (DFII10)
3. Federal Reserve Bank of St. Louis (FRED) – 10-Year Breakeven Inflation Rate (T10YIE)
4. GoldSilver – Live Gold Price Chart
5. GoldSilver – Live Silver Price Chart
6. Business Recorder – Gold Slips as Fed Officials Signal Rate Hikes
7. LunarCrush – XAUUSD Social Sentiment Topic Page
Disclaimer: This article is for informational purposes only and does not constitute investment advice. Past performance is not indicative of future results. Always consult a qualified financial advisor before making investment decisions.
You May Also Like:
- How to Read a Gold Spot Price Chart: The 4 Things That Actually Matter
- Central Banks Hold 80% of Reserves in Gold. Sovereign Wealth Funds Hold Under 1%.
- You Don’t Need to Take Delivery to Sell Your Gold. Here’s What Actually Happens.
- The Real Price of a 1 Gram Gold Bar Isn’t $140
- What Are Negative Real Interest Rates, and Why Does Gold Thrive in This Environment?
- Cheapest Way to Buy Gold? We Measured 110 Live Prices
- How Much Silver Should You Own? A Portfolio Allocation Guide by Age and Goal
- Who Owns US Debt? Central Banks Own Less Than You Think