Every day, gold and silver prices tick up, tick down, and sometimes swing sharply enough to make headlines. A stronger jobs report sends gold lower. A geopolitical flare-up sends it higher. Silver jumps 4% in a day — then gives half of it back.
If you check prices daily, it can feel like financial whiplash. And the natural response is to do something: sell before it drops further, wait for a better entry point, or wonder if the thesis you believed in last month still holds.
That impulse is understandable. It’s also exactly what shakes most investors out before the real gains arrive.
The investors who benefit most from precious metals aren’t the ones reacting to every headline — they’re the ones who understand the difference between noise and signal.
What Is “Noise” vs. “Signal” in Gold and Silver Prices?
In investing, noise refers to short-term price movements driven by emotion, speculation, or temporary events. These fluctuations often feel significant in the moment but rarely determine long-term outcomes.
Signal, on the other hand, reflects deeper structural forces — inflation cycles, real interest rate trends, currency debasement, central bank behavior, and systemic financial stress.
Gold and silver generate a lot of noise.
- A Federal Reserve press conference.
- A CPI report.
- A currency swing.
- A sudden geopolitical event.
These can move prices in hours. But for long-term investors — those thinking in 5-, 10-, or 20-year horizons — what matters is the structural backdrop. And that backdrop changes far more slowly than daily price charts suggest.
The Financial System Isn’t Safer — And You Know It As risks mount, see why gold and silver are projected to keep shining in 2026 and beyond.
What Drives Short-Term Price Fluctuations?
Most daily moves come down to a handful of recurring forces.
Macroeconomic data — jobs reports, CPI, GDP — triggers rapid repositioning by traders. Strong numbers often push gold lower as investors rotate toward risk assets, even if the longer-term inflation picture hasn’t changed. Federal Reserve policy works similarly: rising rate expectations pressure gold in the short run, though that relationship tends to break down over full economic cycles.
Currency movements add another layer. Because gold is priced globally in U.S. dollars, a strengthening dollar can push prices down in dollar terms even when underlying demand remains strong. Futures markets amplify all of this — large leveraged positions on exchanges like COMEX can exaggerate swings that have little to do with physical supply and demand. Geopolitical flare-ups layer on top, spiking prices quickly before partially retracing once tensions cool.
Silver responds to all of the above, and then some. Its industrial demand across electronics, solar, and medical applications makes it more economically sensitive than gold — which is why it tends to move harder in both directions.
These forces are real. They move prices. But they don’t define long-term outcomes.
The Long-term Signals that Matter
While traders react to this month’s CPI print, the structural forces shaping precious metals over full economic cycles are moving much more slowly — and they’re far more consequential.
The most reliable of these is real interest rates. When inflation-adjusted returns on bonds and cash turn negative, savers lose purchasing power by staying conventional. Gold becomes more attractive not as a speculation, but as a straightforward store of value. Related to this is the longer arc of currency debasement: fiat currencies have lost purchasing power across decades, while gold has historically preserved it. That’s not a quarterly thesis — it’s a multi-generational one.
Central bank behavior reinforces the signal. Global central banks have been net buyers of gold for over a decade, a structural expression of waning confidence in fiat currency systems that doesn’t reverse on a single data release. For silver, the long-term tailwind is the energy transition — electrification and solar infrastructure require substantial silver input, and that demand curve is still building.
Underlying all of it is confidence in the financial system itself. When doubts grow about debt sustainability, banking stability, or monetary policy credibility, gold tends to benefit. These shifts are slow and easy to dismiss in the short run. But they’re what ultimately determine the direction of entire cycles — which is exactly what the 1970s made clear.
The 1970s: A Masterclass in Volatility — and Conviction
If you want proof that volatility doesn’t invalidate a long-term bull market, look at the 1970s. Between 1971 — when the U.S. closed the gold window — and 1980, gold rose from $35 per ounce to over $800. Silver surged from roughly $1.50 to nearly $50.
On paper, it sounds like a straight line higher. The annual returns tell a different story.
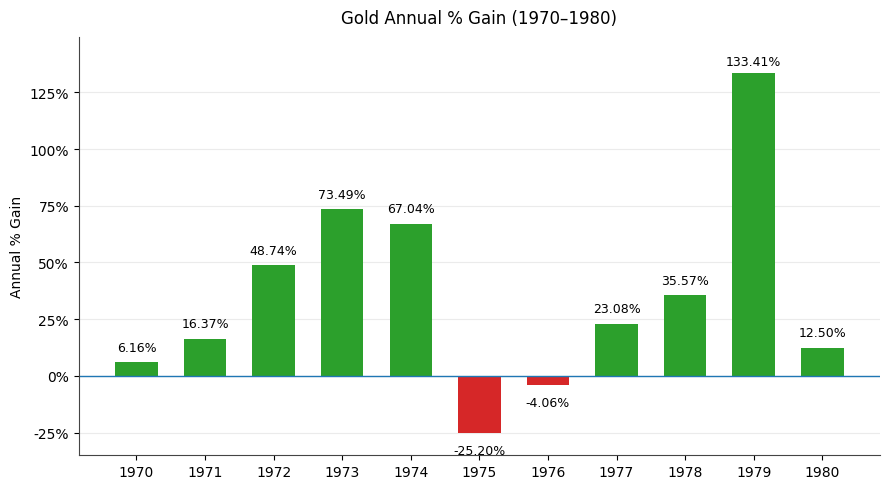
Gold posted strong gains in most years, but 1975 and 1976 were bruising — a combined decline following a massive run-up that likely shook out plenty of investors who bought near the 1974 peak.
The reward for those who held came later: a 133% single-year gain in 1979.
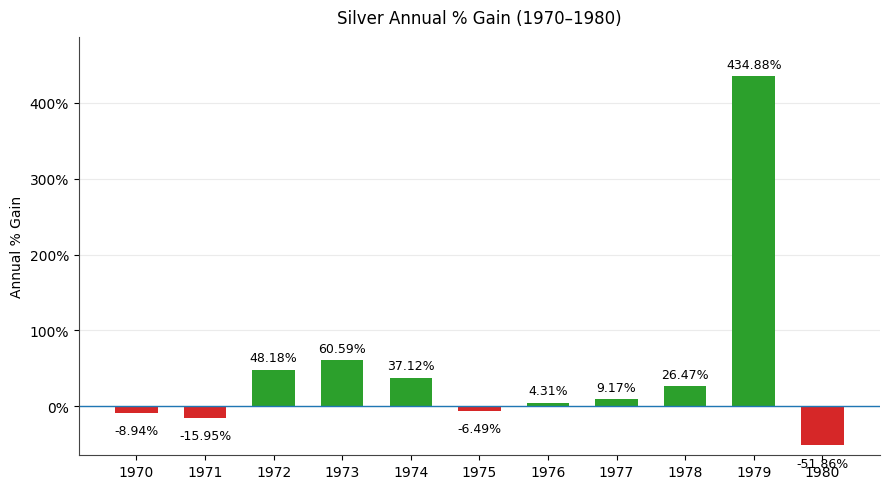
Silver was even more unforgiving. It opened the decade with back-to-back down years, spent 1975 in the red, and then delivered a staggering 434% return in 1979 alone — before giving a significant portion back in 1980. Investors who bailed during any of those down stretches didn’t just miss a modest rebound. They missed the entire payoff.
Imagine holding through two negative years at the start of the decade, watching prices stagnate, and deciding you’d been wrong — only for silver to ultimately deliver one of the most explosive single-year runs in commodity history.
That’s what short-term noise costs long-term investors.
The structural signal throughout the decade was clear: inflation, currency debasement, and eroding confidence in the monetary system. The volatility was real, but it was never the story. Investors who stayed focused on the underlying fundamentals were rewarded. Those who let the noise make their decisions for them were shaken out before the biggest gains arrived.
How Long-Term Investors Can Tune Out the Noise
If your goal is wealth preservation, portfolio diversification, or inflation protection, your behavior should match your time horizon.
- Stop Obsessing Over Daily Prices: Watching gold prices every morning is like checking the weather every five minutes. It doesn’t change the climate.
- Align Strategy With Purpose: Are you holding metals to trade short-term moves — or to hedge long-term monetary risk? The strategy must match the objective.
- Use Dollar-Cost Averaging: Rather than attempting to time perfect entry points, consistent accumulation can smooth volatility and reduce emotional decision-making.
- Set Allocation Intentionally: Many conservative investors maintain 5–10% exposure to gold. Those seeking higher volatility and upside potential may tilt more toward silver — understanding it will swing harder in both directions.
- Focus on Structural Data: Real rates. Inflation trends. Central bank buying. Debt dynamics. These matter far more than the next headline.
The Bottom Line: Volatility Is the Price of Conviction
Gold and silver have always been volatile. That’s not a bug — it’s the nature of assets that exist outside the financial system and respond to forces most investors spend years ignoring.
The daily noise will always be there: the Fed statement, the jobs number, the geopolitical headline. None of it changes the structural backdrop. Real rates, currency debasement, central bank behavior, and confidence in the financial system don’t resolve in a news cycle — they unfold over years. That’s the timeline that matters.
The only real question is whether your decisions are driven by this morning’s price chart or by the forces shaping the next decade. For investors focused on preserving purchasing power across economic cycles, volatility isn’t something to fear. It’s the cost of admission.
Investing in Physical Metals Made Easy

People Also Ask
What is the difference between short-term noise and long-term signals in gold and silver prices?
Short-term noise is price movement driven by temporary events — a Fed press conference, a jobs report, a geopolitical flare-up — that often reverses quickly and carries little predictive value. Long-term signal reflects structural forces like inflation cycles, real interest rates, currency debasement, and central bank behavior that unfold over years. The distinction matters because investors who react to noise often get shaken out before the signal pays off.
What factors cause short-term volatility in gold and silver prices?
Short-term volatility in gold and silver is primarily driven by Federal Reserve policy signals, macroeconomic data releases (CPI, jobs reports, GDP), U.S. dollar movements, geopolitical events, and speculative futures trading on exchanges like COMEX. Silver carries additional sensitivity to industrial demand data — making it more volatile than gold in both directions.
Why are gold and silver considered long-term investments?
Gold and silver have historically preserved purchasing power across decades of inflation, currency debasement, and financial crises — something few conventional assets can claim. Their low correlation with stocks and bonds makes them effective portfolio diversifiers, and their value tends to compound over full economic cycles rather than individual years. Short-term volatility is real, but investors who focus on the structural backdrop have historically been rewarded for staying patient.
How do macroeconomic conditions impact gold and silver prices over time?
The most significant macroeconomic driver is real interest rates. When inflation-adjusted returns on cash and bonds turn negative, gold becomes more attractive as a store of value. Persistent inflation erodes fiat currency purchasing power — historically one of the strongest tailwinds for both metals. Over longer horizons, structural trends like sustained central bank gold buying and growing industrial silver demand from the energy transition create compounding price pressure that daily data releases rarely capture.
How can investors identify meaningful trends in gold and silver markets?
Focus on structural indicators rather than daily prices: real (inflation-adjusted) interest rates, central bank reserve accumulation, inflation trajectory, and long-term currency trends. For silver specifically, monitoring the gold-to-silver ratio can be useful — historically, readings above 80:1 have preceded periods of silver outperformance. Dollar-cost averaging and a multi-year time horizon help investors stay anchored to the signal rather than reacting to short-term noise.
Disclaimer: This article is for informational purposes only and does not constitute investment advice. Always consult a qualified financial advisor before making investment decisions. Past performance is not indicative of future results.
You May Also Like:
- Silver Canadian Maple Leaf: Why It’s One of the World’s Top Bullion Coins
- Gold Portfolio Allocation 2026: What J.P. Morgan’s Forecast Means for Investors
- How Government Debt Affects Gold and Silver
- Gold vs Silver: The Liquidity Difference That Matters
- Silver Price Components: Premium, Spot, and Dealer Markup Explained