Silver Rises Over 120% YTD




Published: 07-28-2026, 09:21 am | Updated: 07-28-2026, 09:22 am
Gold is trading at $4,030 per ounce this morning, down $46 from yesterday’s open. [GoldSilver] Silver is at $57.39, down $1.00. Both metals fell as the Federal Reserve’s two-day July meeting officially opened. The decision arrives tomorrow, July 29, at 2:00 p.m. ET.
The price drop has nothing to do with Iran. The three-day ceasefire is still holding. Oil is actually lower this week. The drop also has nothing to do with any news that broke overnight. It has everything to do with a number that moved quietly over the past two weeks, and most headlines have ignored it.
Why Did Hike Odds Double in Two Weeks?
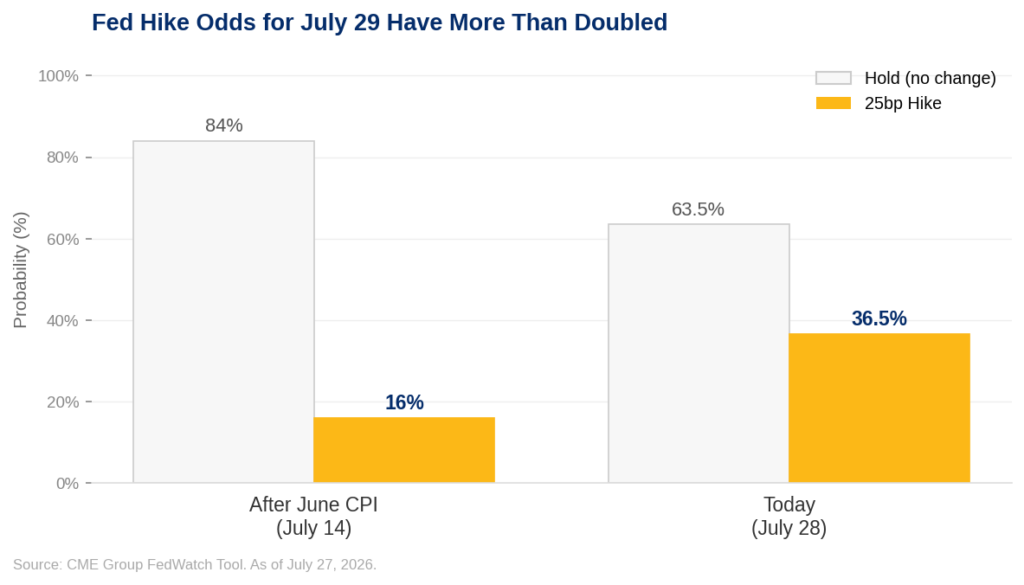
Two weeks ago, on July 14, the Bureau of Labor Statistics reported that headline inflation fell from 4.2% in May to 3.5% year-over-year in June. That single print cut the market’s implied probability of a rate hike at this week’s meeting from a peak near 46% down to 16%, according to CME Group FedWatch data. Gold rallied on that news.
Since then, the odds have rebuilt steadily. As of Monday, July 27, CME FedWatch puts the probability of a 25 basis point rate hike at 36.5%. The probability of no change is 63.5%. [CME Group, July 27, 2026] That is a rise of more than 20 percentage points in two weeks, driven by two things: a JOLTS report showing job openings at their highest level in two years, and oil prices that climbed more than 20% in July before this week’s ceasefire pullback. Even after the ceasefire, energy-driven inflation remains elevated enough to keep hike pressure alive.
So what does a higher hike probability have to do with gold? Everything.

The Edge Every Investor Needs Smarter precious metals investing starts here. The Nuggets Newsletter brings you essential market insights, Fed updates, global trends, educational videos, and much more.
What Does a Fed Rate Hike Actually Do to Gold?
The mechanism works in four steps.
First, when hike expectations rise, nominal Treasury yields reprice higher. The 10-year yield is currently near 4.64%, up from approximately 4.30% six weeks ago. [U.S. Treasury]
Second, higher nominal yields — if they outrun inflation expectations — push real yields higher. Real yields represent the inflation-adjusted return on government bonds. When real yields rise, bonds pay more after inflation. When they fall, they pay less.
Third, gold pays nothing. No coupon, no dividend. So when real yields rise, the opportunity cost of holding gold rises alongside them. Investors holding gold are forgoing income that bonds now offer.
Fourth, gold prices adjust downward to reflect that higher opportunity cost.
This is not a theory. According to research published by PIMCO, changes in real yields explain the majority of short-term moves in gold prices. The relationship has held for decades. A 25 basis point rise in the real yield typically corresponds to a $40 to $60 decline in gold. Today’s $46 move fits that range precisely.
Why Is the Structural Case for Gold Still Intact?
Understanding short-term rate pressure does not mean accepting it as the whole story. There is a structural ceiling on how far and how long the Fed can maintain elevated rates.
As of mid-2026, total U.S. gross national debt exceeds $39 trillion. Annual interest payments are running above $1 trillion. [U.S. Treasury] Every additional rate increase raises the cost of servicing that debt. At some point, fiscal constraints put a practical ceiling on the rate path. This is not about legal authority. It is because sustained higher rates accelerate a debt spiral the federal government cannot absorb indefinitely.
The market already senses this. September rate hike odds are priced at roughly 79% cumulatively, but by year-end, futures markets assign the highest probability to a rate ceiling, not an open-ended tightening cycle.
Gold’s short-term price reflects today’s hike arithmetic. The structural bid reflects the longer-term arithmetic.
Today’s FOMC meeting includes no Summary of Economic Projections and no dot plot. Tomorrow’s statement and Chair Kevin Warsh’s press conference at 2:30 p.m. ET will carry more interpretive weight than most. Watch the statement language carefully for any signal about September.
The number that may move gold more than either of those events arrives Thursday morning. June PCE data — the Fed’s preferred inflation gauge — releases at 8:30 a.m. ET on July 30. [Bureau of Economic Analysis] If PCE comes in soft, it reopens the question of whether this week’s hike pressure was a temporary spike or a durable shift.
Stay On Top of Gold & Silver Prices
Get important market alerts sent straight to your inbox.
SOURCES
1. GoldSilver — Live Gold and Silver Spot Prices, July 28, 2026
2. Bureau of Labor Statistics — Consumer Price Index Summary, June 2026
3. CME Group — FedWatch Tool, July 2026 FOMC Rate Probabilities
4. U.S. Department of the Treasury — Daily Treasury Par Yield Curve Rates
5. PIMCO — Understanding Gold Prices
6. U.S. Treasury — Fiscal Data: America’s Finance Guide — National Debt
7. Bureau of Economic Analysis — Personal Income and Outlays Release Schedule
Disclaimer: This article is for informational purposes only and does not constitute financial or investment advice. Always consult a qualified financial adviser before making investment decisions.
You May Also Like:
- The Fed Votes Wednesday. Watch the Tally, Not the Decision.
- Oil Dropped 7%. Gold Rose. Here Is the Mechanism Everyone Misses.
- Oil Spiked 7% Yesterday. Silver Sold Off. Today Physical Buyers Are Doing Something Different.
- Newmont Earned $2.2 Billion Last Quarter. Gold Was Down 13%.
- The US Has Over $1 Trillion in Gold. Washington Carries It on the Books at $11 Billion.
- 187,000 Jobless Claims. The Lowest of 2026. Here Is What It Means for Gold.