Silver Rises Over 120% YTD




Published: 07-16-2026, 04:50 pm
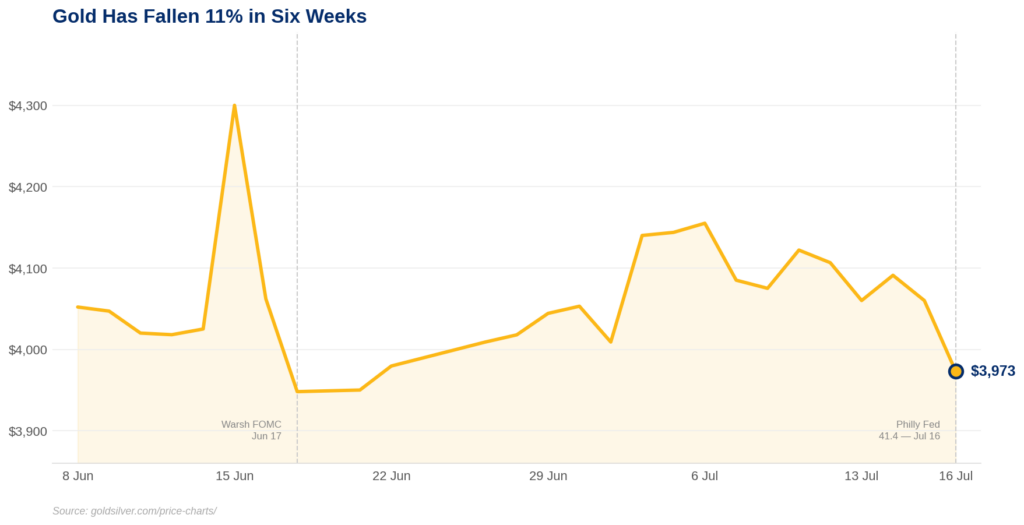
Gold fell 2.2% on Thursday, July 16, 2026, dropping to $3,973 per ounce as factory activity in the United States hit its strongest level in years. The Philadelphia Fed manufacturing index jumped to 41.4 in July, more than three times the consensus estimate of 13. Meanwhile, initial jobless claims fell to 208,000 for the week ending July 11, well below the estimate of 217,000. Both numbers told the same story: the economy is resilient, the Fed has no reason to cut, and gold paid the price.
This is not a contradiction. It is the mechanism.
Why Does Strong Manufacturing Data Push Gold Prices Lower?
Gold is negatively correlated with real yields. When the economy runs hot, the Federal Reserve has reason to keep interest rates elevated. Higher rates mean higher real yields — the nominal rate minus expected inflation. Because gold pays no interest, a higher real yield raises the opportunity cost of holding it. Investors can earn a return elsewhere, so some of them sell.
That chain ran cleanly on Thursday morning. The Philly Fed number dropped at 8:30 AM ET. By mid-morning, gold had given back nearly $90 from its open of $4,060. Silver fell even harder, declining roughly 4% to $55.47, because silver runs on two engines at once: monetary demand and industrial demand. Strong manufacturing data is good news for industrial output in theory, but it is bearish in the near term because it keeps the Fed on hold.
A 25-basis-point move in real yields typically moves gold $40 to $60 per ounce, according to the historical relationship documented by the World Gold Council. Thursday’s data did not trigger an actual rate change. However, it raised the probability of one. Traders on the CME FedWatch tool pushed the odds of a September rate hike to roughly 51% by late afternoon.

The Edge Every Investor Needs Smarter precious metals investing starts here. The Nuggets Newsletter brings you essential market insights, Fed updates, global trends, educational videos, and much more.
What Did the Philadelphia Fed Manufacturing Index Actually Show?
The Philadelphia Fed manufacturing index surveys roughly 250 manufacturers in eastern Pennsylvania, southern New Jersey, and Delaware. It is one of the earliest monthly reads on US factory conditions. A reading above zero means expansion. A reading of 41.4 is not just expansion — it is the kind of acceleration that changes the Fed’s calculus.
In June, the index sat at 10.3. So this was not a modest improvement. It was a surge of more than 31 points in a single month, compared to a consensus forecast of 13.0. New orders and shipments both rose, with the general activity and new orders indexes reaching nearly five-year highs. Add the jobless claims figure — 208,000 claims versus an estimate of 217,000 — and you have a labor market that is still tight running alongside a manufacturing sector that just accelerated. That combination leaves the Federal Reserve with little justification to ease monetary policy ahead of its July 28–29 meeting.
What Should Gold Investors Watch Next?
Tomorrow, Friday July 17, the University of Michigan releases its preliminary consumer sentiment and inflation expectations survey for July. Long-run inflation expectations have stayed above 3% since the Iran conflict began in late February, even as gas prices eased through June. If Friday’s figure moves higher again, it adds another layer of pressure on the Fed.
The FOMC meets July 28–29. A hold is the consensus, but the data this week — retail sales up 0.2% in June (released Thursday), a Philly Fed reading that tripled the forecast, and tight jobless claims, also released Thursday — has reduced the probability of any easing signal. Gold is approaching its lowest level since November 2025. It has now fallen roughly 29% from its January 28, 2026 all-time high of $5,589 per ounce.
Still, one day’s manufacturing data does not reset the structural arithmetic. The US government ran a deficit of $1.8 trillion in fiscal 2025. Annual interest payments on the national debt hit $970 billion in fiscal 2025 — the largest in history and on track to cross $1 trillion in fiscal 2026, according to the Congressional Budget Office. The money supply must keep expanding to service that debt. None of those figures changed on Thursday morning when 250 factory managers in Pennsylvania filed a survey. So even though today’s gold price move is real and the mechanism behind it is real, the debasement math that underpins a long-term allocation to physical gold is also real — and it does not depend on what the Fed does at any single meeting.
The gold price fell today because a resilient economy reduces the urgency of rate cuts. That is the short-term story. The long-term story is why a resilient economy running on borrowed money keeps the structural case for sound money intact. For more on the July price picture, see our gold price outlook for July.
Stay On Top of Gold & Silver Prices
Get important market alerts sent straight to your inbox.
SOURCES
1. Federal Reserve Bank of Philadelphia — Manufacturing Business Outlook Survey, July 2026
2. Bureau of Labor Statistics — Unemployment Insurance Weekly Claims, week ending July 11, 2026
3. CME Group — FedWatch Tool, September 2026 FOMC Meeting Probabilities
4. GoldSilver.com — Live Gold and Silver Spot Prices, July 16, 2026
5. World Gold Council — Gold and Real Yields: The Historical Relationship
6. Congressional Budget Office — Monthly Budget Review: Summary for Fiscal Year 2025
Disclaimer: This article is for informational purposes only and does not constitute financial or investment advice. Always consult a qualified financial adviser before making investment decisions.
You May Also Like:
- Warsh Told Wall Street to Stop Watching the Fed. Gold Already Knew.
- Gold Falls as Retail Sales Confirm the Fed Has No Reason to Cut
- Silver Dropped 1.4% Today. Gold Didn’t. The Ratio Just Hit 70:1.
- Gold Holds as CPI and PPI Both Miss. Here’s Why.
- Gold Is Flat. Oil Is Up 9%. Here’s Why.
- Gold and Fed Policy: When the System Picks Winners