Daily News Nuggets | Today’s top stories for gold and silver investors
February 18th, 2026 | Brandon Sauerwein, Editor
Gold Stabilizes After January Shock
Since January 30’s sharp selloff, gold has carved out a defined $4,600–$5,100 trading range — establishing clear gold price support levels in the process.
Gold Price Support Levels — $4,600 to $5,100 Range
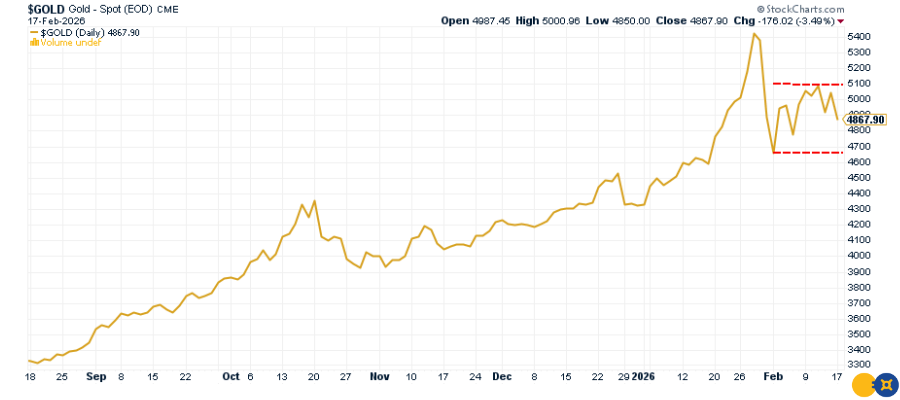
At its late-January peak, gold traded above $5,550. The subsequent liquidation pushed prices down to roughly $4,600 — a decline of about 17% in a short span.
The selloff tested support near $4,600. Buyers stepped in decisively, and price has stabilized around that level.
Rallies toward $5,100 have met resistance. Yet there is still no evidence of structural breakdown. The market is digesting gains rather than unwinding them.
In established bull markets, sharp drawdowns often transition into consolidation as leverage clears and longer-term capital accumulates. Gold appears to be following that pattern.
What to watch next: A decisive break above $5,100 would likely signal the next leg higher. A sustained move below $4,600 would challenge the current structure.
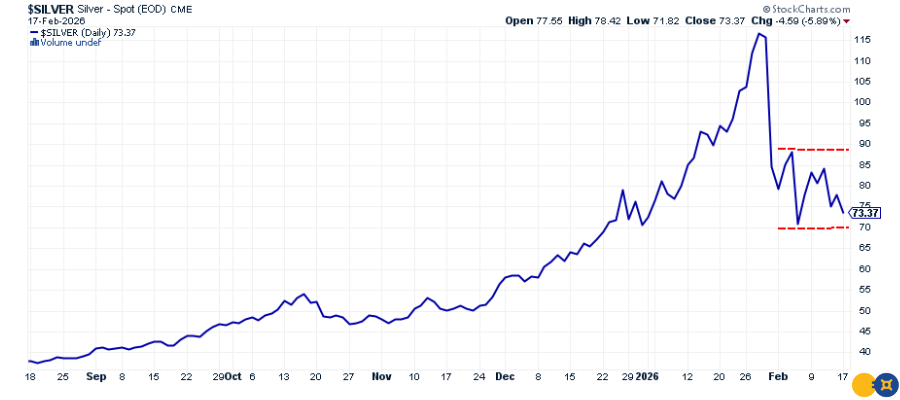
Silver Swings Wide — But Support Holds
Silver’s January plunge was the steepest one-day percentage decline on record. Since then, volatility has remained elevated, though the market is beginning to trade with more structure.
The metal has traded between roughly $70 and $88, a far wider percentage range than gold.
Silver Trading Range — Support Near $70, Resistance Near $88
That’s classic silver. It carries higher beta and amplifies both fear and momentum.
What matters now is support. The $70 level has held multiple tests, with aggressive buying on each dip. That suggests the forced liquidation phase has largely run its course.
Resistance in the mid-to-high $80s remains intact. For now, the market appears to be coiling. Range compression after a sharp drawdown often precedes expansion. Silver rarely stays quiet for long.
Industrial demand remains firm, particularly from energy and technology sectors. At the same time, monetary uncertainty is rising. Yet many investors remain focused on short-term rate headlines rather than longer-term supply dynamics.
That disconnect could prove temporary.
Over the next few weeks, the key level we’ll be watching is $88. A sustained break above that level would likely ignite fresh momentum and draw capital back into the sector.
Stay Ahead with Gold & Silver News The most important market insights, Fed updates, and global trends — everything investors need to make smarter, safer decisions.
Mining Stocks Show Relative Momentum Despite Volatility
Despite recent volatility in gold and silver prices, the mining sector is showing signs of resilience.
On the TSX Venture Exchange, 1911 Gold and Cerrado Gold ranked among the top-performing companies of 2026 — notable outperformance in a market where juniors typically lag during uncertainty.
Meanwhile, Monument Mining reported encouraging drill results from its Selinsing expansion program, hinting at potential resource growth. Maxus Mining also began trading on the OTCQB, broadening U.S. investor access and improving liquidity.
Mining stocks often act as a leading indicator for sentiment in the precious metals complex. When capital begins rotating into junior explorers during price consolidation, it can signal rising confidence in the underlying commodity.
And it’s not just investors positioning for the next cycle — Washington appears to be stepping in as well.
Washington to Establish Price Floors for Critical Minerals
U.S. agencies have reportedly developed a system to establish price floors for critical minerals — a move designed to stabilize domestic supply chains and reduce reliance on foreign producers.
The framework would guarantee minimum pricing for key resources such as lithium, nickel, and rare earths. That protection shields U.S. mining projects from volatile price swings that often stall long-term investment.
Why it matters: governments don’t intervene unless they see strategic risk. This policy signals growing concern over supply security as geopolitical tensions rise and energy transition demand accelerates.
For investors, the takeaway is broader than battery metals. When governments begin underwriting real assets, it reinforces the structural value of tangible resources. Hard commodities are no longer just cyclical trades — they’re becoming pillars of national strategy.
That shift comes at a time when U.S. financial markets themselves are losing some of their long-held dominance.
U.S. Stocks Off to Worst Relative Start Since 1995
U.S. equities are off to their worst start relative to global markets in three decades. Through early 2026, international stocks have significantly outperformed the S&P 500 — marking the largest gap since 1995.
For years, U.S. markets dominated on the back of mega-cap tech and strong economic growth. But that leadership is showing signs of strain. A stronger dollar, elevated valuations, and uncertainty around Fed policy have weighed on domestic equities, while international markets — particularly in Europe and parts of Asia — are benefiting from lower starting valuations and improving growth expectations.
This shift doesn’t necessarily signal a structural decline in U.S. markets. But it does challenge the assumption that American exceptionalism is guaranteed.
Leadership rotates. Crowded trades eventually unwind. When concentration risk rises and dominance fades, diversification becomes more important — especially in uncertain policy environments.