Silver Rises Over 120% YTD




Published: 07-30-2026, 03:29 pm
June’s inflation reading arrived Thursday morning. The Federal Reserve’s preferred gauge, the Personal Consumption Expenditures price index, fell to 3.7% year-over-year, down from 4.1% in May, and dropped 0.1% on the month, according to the Bureau of Economic Analysis.
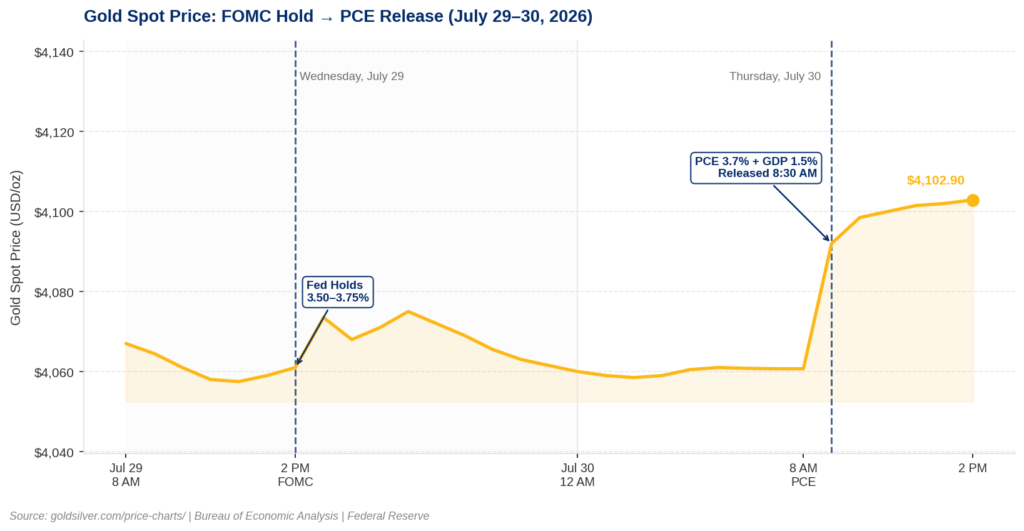
Gold opened $34 higher. As of Thursday afternoon, spot gold trades at $4,102.90, up 0.86% on the day, per GoldSilver’s live price charts. Silver is up 1.43% to $58.77. If you expected cooler inflation to push gold lower, here is why that model is incomplete.
Why Did the PCE Drop Not Push Gold Lower?
The BEA report contained two numbers that pulled in opposite directions, and the headline only told half the story.
The PCE decline was real, but narrow. It was driven primarily by falling energy prices tied to the temporary Iran ceasefire lull in June, per CNN reporting published July 30, 2026. Core PCE — which strips out food and energy — rose 0.1% on the month and held at 3.3% year-over-year. That marks the fourth consecutive month core PCE has held at or above 3.3%, the longest such stretch since the fall of 2023, per CNN.
Moreover, the same BEA release showed the GDP Price Index for Q2 coming in at 6.3%, nearly double the 3.6% economists expected, according to the Bureau of Economic Analysis. That figure measures price changes in domestically produced goods and services — manufacturing output, business investment, and government production — excluding imports. It captures inflation embedded in the output side of the economy that the consumer-facing PCE does not reach. Inflation was cooling at the surface and accelerating underneath.

The Edge Every Investor Needs Smarter precious metals investing starts here. The Nuggets Newsletter brings you essential market insights, Fed updates, global trends, educational videos, and much more.
What Did Warsh Say — and Why Does It Matter for Gold?
Fed Chair Kevin Warsh walked out of Wednesday’s press conference and said the cooler data was “not much” of a consideration, according to CNBC’s reporting on the July 29, 2026 press conference. In the official opening statement published by the Federal Reserve, Warsh stated directly: “five-plus years of inflation above target cannot be cured in nine weeks — or by a single month of modest price decreases.” The Chair of the Federal Reserve told the market to its face that a good PCE reading does not change his calculus.
Consequently, the FOMC voted 9-to-3 on Wednesday to hold rates at 3.50% to 3.75%, with Cleveland Fed President Beth M. Hammack, Minneapolis Fed President Neel Kashkari, and Dallas Fed President Lorie K. Logan all dissenting in favor of an immediate hike. As of Thursday, the CME FedWatch tool showed roughly 58% odds of a rate hike at the September meeting, according to Fox Business — probabilities that shift intraday as markets absorb competing signals from Thursday’s data.
What Does the GDP Price Index Mean for Precious Metals Investors?
The GDP Price Index measures price changes in domestically produced goods and services — manufacturing, business investment, government output, and exports. Imports are excluded. When that number hits 6.3% against a consensus of 3.6%, inflation is embedded in the productive side of the economy at a rate the consumer-facing PCE does not reach.
Gold investors reading only the PCE saw a promising number. Those reading the full BEA release saw slowing growth paired with accelerating economy-wide price pressure — a combination with a well-documented historical track record for precious metals. Gold was up more than 600% in real terms during the stagflation of the 1970s, according to GoldSilver’s historical analysis of the 1970s gold correction.
What Does This Mean for Your Holdings Going Forward?
The September 15–16 FOMC meeting is the next key date, with Warsh’s Jackson Hole speech on August 27–29 the first major signal before it. Today’s data has already moved September pricing: the weaker GDP print has eased immediate hike odds, yet the GDP Price Index has kept longer-term inflation pressure visible. The market cannot settle on one narrative because the data is not giving it one.
For holders of physical gold and silver, that unresolved tension is the point. The structural case does not depend on any single inflation print cooperating. It depends on a Fed that is constrained, an economy running hotter internally than the headline gauge shows, and real purchasing power eroding regardless of monthly oscillations. Silver’s outperformance today — up 1.43% versus gold’s 0.86% — reflects a compression in the gold-silver ratio from recent highs near 70. June PCE fell. Gold still went up. The mechanism, not the headline, is always the story.
Stay On Top of Gold & Silver Prices
Get important market alerts sent straight to your inbox.
SOURCES
1. Bureau of Economic Analysis — GDP (Advance Estimate), 2nd Quarter 2026
2. Bureau of Economic Analysis — Personal Income and Outlays, June 2026
3. Federal Reserve — Chairman Warsh’s Press Conference Opening Statement, July 29, 2026
4. CNBC — Analysis: Fed Chairman Warsh’s credibility in question after leaving interest rates unchanged
5. CNN — The Fed’s preferred inflation gauge cooled in June. It might not last.
6. Fox Business — July FOMC: Fed holds interest rates steady
7. GoldSilver — Live Gold Spot Price
8. GoldSilver — Live Silver Spot Price
Disclaimer: This article is for informational purposes only and does not constitute financial or investment advice. Always consult a qualified financial adviser before making investment decisions.
You May Also Like:
- Gold at $4,100. Silver Still Stuck Below $60. Five Signals Define the Next Six Weeks.
- Oil Spiked 8%. Gold Went Up Anyway. Here Is Why This Time Is Different.
- Gold Is Up $40. Here Is What the 9-3 Fed Vote Actually Means.
- Iran Fired Missiles. Oil Spiked 6%. Gold Fell. The Three-Step Chain Behind the Move.
- Everyone Is Watching the Fed. Gold Is Watching Tomorrow at 8:30 a.m.
- Gold Is Down $48. Here Are the Five Reasons Why.