Published: 06-12-2026, 09:07 am | Updated: 06-12-2026, 11:23 am
Over the past 30 days, gold has fallen about 10%. Silver has fallen more than twice that.
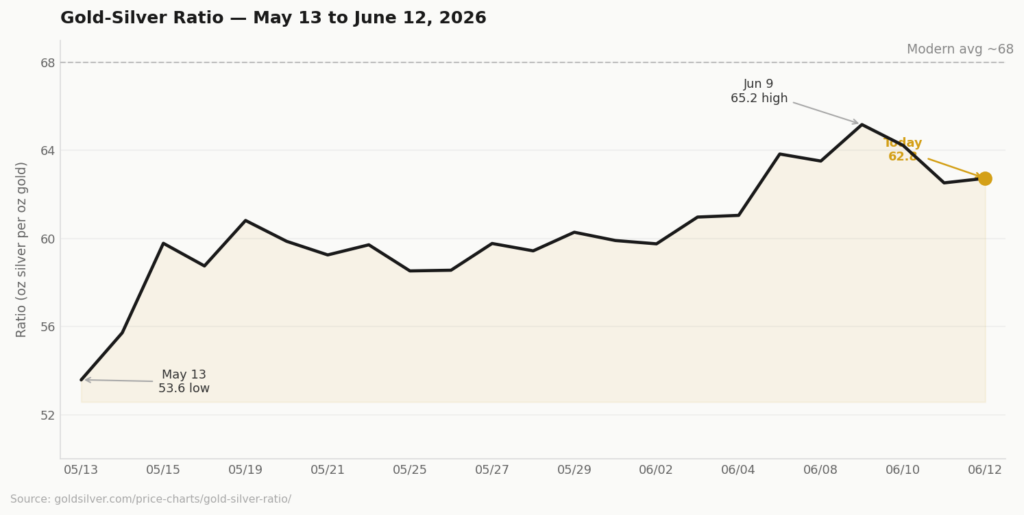
As of Friday morning, the gold-silver ratio sits near 63 — meaning it now takes more than 63 ounces of silver to buy one ounce of gold. A month ago, that number was 55. The more-than-8-point swing is not noise. It has a name, a mechanism, and a track record of what tends to happen when it resolves.
Why does silver move differently than gold?
Gold is almost purely a monetary metal. Its price responds to real yields, dollar strength, and the health of the fiat currency system. Silver does too — but silver also carries an industrial engine running alongside it. Solar panels. Electric vehicles. Electronics. Data centers. That industrial engine consumes roughly 660 million ounces of silver per year (Silver Institute, World Silver Survey 2026).
When monetary fear dominates markets — rate-hike expectations, inflation shock, central bank uncertainty — investors park capital in gold first. Gold is the flight-to-safety trade. Silver gets dragged up as a monetary metal. However, its industrial component makes it more exposed to growth slowdowns and high-cost headwinds.
Right now, both of silver’s engines are running into resistance simultaneously.
The monetary engine is suppressed. The Iran war, which began on February 28, sent energy prices sharply higher. That energy inflation flowed into CPI. Consequently, May’s producer price index printed at 6.5% year-over-year — the highest level since November 2022, according to the Bureau of Labor Statistics. Markets responded by pricing in tighter monetary policy. When you price in higher rates, the monetary engine for gold and silver runs colder.
Gold fell, but its purely monetary nature gave it a floor. Silver fell harder. Both of its engines ran into resistance at the same time. The monetary engine ran colder. Meanwhile, high prices pushed solar manufacturers to reduce silver intensity in their panels.
The ratio widened. That is the mechanism.

The Edge Every Investor Needs Smarter precious metals investing starts here. The Nuggets Newsletter brings you essential market insights, Fed updates, global trends, educational videos, and much more.
What does a gold-silver ratio above 60 historically signal?
The ratio does not operate in isolation. Context matters.
The 60–75 zone is near the modern historical average. It is not an extreme. For comparison, the ratio hit 125 during the March 2020 COVID panic, when silver crashed while gold held. Before that, it reached 88 in early 2024 — right before silver gained roughly 144% through 2025.
The direction of the move matters as much as the level. A ratio that spikes more than 8 points in 30 days is telling you the monetary engine is suppressed, not absent. The physical market underneath has not changed. The Silver Institute’s World Silver Survey 2026, produced with Metals Focus, projects a 46.3-million-ounce supply deficit for this year — the sixth consecutive annual shortfall since 2021.
The reader who holds physical silver is holding an asset the ratio calls cheap and the supply data calls scarce. Those two signals are rarely wrong at the same time.
When the suppressor lifts, the monetary engine tends to re-engage quickly. And it re-engages from a physical market that has been running short for half a decade.
What could push the gold-silver ratio lower from here?
There are two events in the next five days that could matter.
The first is the Iran peace deal. As of Friday morning, Bloomberg is reporting that the US and Iran may sign an agreement to reopen the Strait of Hormuz on the sidelines of the G7 summit next week. The signing could happen as early as this Sunday in Switzerland. A senior Iranian official indicated overnight that a deal is “likely,” according to G7 officials cited by Bloomberg. The expected form is a memorandum of understanding. Under it, Iran would reopen Hormuz within 30 days in exchange for sanctions relief. Iran’s foreign ministry has not issued a formal confirmation. Khamenei has yet to sign off. But the language from both sides has moved from “conceptual” to “likely.” If the MoU holds, oil falls, energy inflation cools, and the rate-hike probability suppressing the monetary engine declines. Therefore, silver’s monetary engine begins to re-engage.
The second is the Federal Reserve’s June 16–17 meeting. The rate decision is settled — markets price near-certainty that the Fed will hold at the current 3.50–3.75% range. What is not settled is the dot plot. This is Kevin Warsh’s first meeting as Fed Chair and the first Summary of Economic Projections under his tenure. If the median projection signals fewer rate hikes than feared, the monetary suppressor on both metals loosens.
Neither is certain. The Iran MoU still requires Khamenei’s sign-off. The dot plot could go hawkish. But the setup heading into both events is this: the ratio spiked on monetary fear. If that fear resolves, the ratio compresses. And silver tends to compress it faster than gold expands it.
Why does the structural silver supply deficit matter for price?
One thing the ratio does not capture is the structural supply deficit.
Silver demand has exceeded mine supply every year since 2021. The Silver Institute projects the gap will widen to 46.3 million ounces in 2026. Physical coins, bars, and ETPs are absorbing more of the market than any reduction in solar intensity can offset. There is less silver to buy in the physical market at these prices than there was when the ratio was at 55 in May.
The ratio can stay elevated for extended periods. It spent more than a year above 80 between 2019 and 2020. Mean reversion is a tendency, not a guarantee. But a widening supply deficit combined with a monetary engine that is paused rather than broken is a setup long-term holders of physical silver understand.
At 63, after a 30-day correction driven by a specific and identifiable monetary suppressor, silver is cheaper relative to gold than it was a month ago. The physical market has not loosened. The structural case has not changed.
That is not alarm. That is the arithmetic.
Stay On Top of Gold & Silver Prices
Get important market alerts sent straight to your inbox.
SOURCES
1. LBMA — Precious Metal Prices & Historical Data
2. Silver Institute / Metals Focus — World Silver Survey 2026
3. Bureau of Labor Statistics — Producer Price Index News Release, May 2026
4. Bloomberg — US and Iran Nearing a Peace Deal Around G7 Meeting Next Week
5. CME Group — FedWatch Tool, June 2026
6. Chase / J.P. Morgan Wealth Management — What To Expect at Kevin Warsh’s First Federal Reserve Meeting as Chair
7. Brown Brothers Harriman — Fed Watch: Warsh Takes Charge
8. Babypips — U.S. PPI May 2026 Hits 6.5%, Biggest Annual Surge Since 2022
9. Benzinga — Producer Inflation Jumps To 6.5%, Highest Since December 2022
10. TradingEconomics — Silver Price History, June 2026
11. Britannica — 2026 Iran War
12. GoldSilver.com — Gold/Silver Ratio Price Charts & Historical Data
Disclaimer: This article is for informational purposes only and does not constitute financial or investment advice. Always consult a qualified financial adviser before making investment decisions.
You May Also Like:
- Every Bearish Catalyst Landed at Once. Gold and Silver Went Up Anyway.
- Gold at Seven-Month Lows: Why Geopolitical Fear Is Not Enough
- Gold Slides to $4,130 as Iran War Turns Inflation Against It
- May CPI Printed 4.2%. Core Inflation Beat. So Why Did the Gold Price Drop?
- Gold Is Down 9%. The CPI Print That Could Either Extend the Drop — or End It.
- Gold Price News: Goldman, China, CPI, and the Fed Explained
- Gold Near $4,330 as Rate-Hike Bets Hit 70% and China Acts
- Gold Is Down 22% — The Same Drop as 2022. The Floor Is Not the Same.
- Silver Falls 6% on Jobs Beat. The Six-Year Deficit Didn’t.