Silver Rises Over 120% YTD




Published: 08-14-2026, 09:45 am | Updated: 08-14-2026, 10:05 am
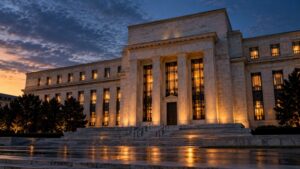
The Federal Reserve held rates steady on July 29 by a 9-to-3 vote. Three members wanted to hike immediately. Since then, two pieces of inflation data have arrived, and both came in softer than expected. Together, they have done something the meeting statement itself could not: they have given the hold majority a defensible data record heading into September.
Gold has responded accordingly.
As of Friday morning, August 14, gold is trading near $4,383 an ounce, up roughly $33 on the day. Silver stands near $65.05 an ounce, up approximately $0.57. Moreover, gold has posted a monthly gain exceeding 10%, its strongest August run in several years, driven almost entirely by the repricing of September rate expectations.
Gold Spot Price — 30-Day Trend (July 15 – August 14, 2026)
Two consecutive soft inflation prints drove a rally to two-month highs
Why Is the Gold Price Up Today?
The catalyst is a two-punch inflation sequence. On Wednesday, the Bureau of Labor Statistics reported that the Consumer Price Index rose 3.4% year-over-year in July. That marks a second consecutive month of year-over-year deceleration, down from 3.5% in June. Additionally, the month-over-month increase came in at just 0.1%. On Thursday, producer price data reinforced the directional picture. The Producer Price Index for final demand came in unchanged month-over-month in July, a meaningful step down from the +0.5% reading in May. As a result, the CME FedWatch tool now shows a 69.4% probability that the Federal Reserve holds rates steady at its September 15–16 meeting. In turn, that is up sharply from 42% just one month ago.
In other words, the mechanism behind this gold price move today is the real-yield equation. Specifically, when markets expect fewer rate hikes, they also expect real yields to remain compressed. Real yields are the nominal interest rate minus inflation expectations. Consequently, the opportunity cost of holding gold, which pays no interest, falls. Gold tends to reprice $40 to $60 per ounce for every 25 basis points of real yield compression. That is the mechanism driving today’s gold price action ahead of next week’s FOMC minutes. For the full breakdown of this week’s numbers, see our analysis of this week’s back-to-back inflation data.
Similarly, silver’s outperformance is a meaningful signal. When the gold-silver ratio compresses, as it has from above 70 in late July to approximately 67.4 this morning, it indicates the market is pricing hold rather than hike. Silver carries both a monetary bid and an industrial one. Therefore, it tends to run harder than gold when rate expectations ease.

The Edge Every Investor Needs Smarter precious metals investing starts here. The Nuggets Newsletter brings you essential market insights, Fed updates, global trends, educational videos, and much more.
What Do the FOMC Minutes Mean for Gold and Silver Investors?
The Federal Reserve releases the minutes from its July 29 meeting on Tuesday, August 19 at 2:00 p.m. ET. Consequently, next Tuesday is the most important data point for gold traders this week. The vote was 9-to-3, and the detailed language of the three dissenters has not yet been made public.
If the minutes show the dissenting trio used conditional language, signaling they would support a hike only if the next inflation print showed renewed acceleration, the September hold case strengthens further. In contrast, if their notes indicate substantially revised inflation forecasts or show the hiking faction actively building the September case, expect gold to give back some of this week’s gains. Fed Chair Kevin Warsh gave no guidance on September policy at Jackson Hole, so Tuesday’s minutes will be the first detailed look at where the committee actually stands.
What Does This Mean for Physical Gold and Silver Holders?
The obvious read is that gold is up because two prints came in soft. However, the deeper read is what those prints reveal about the Fed’s actual room to maneuver. Annual US government interest payments are projected to cross $1 trillion for the first time this fiscal year. The Congressional Budget Office puts that figure up from $970 billion in fiscal year 2025. At the current federal funds rate of 3.50% to 3.75%, servicing above $39 trillion in national debt already exceeds both defense spending and Medicare as a budget category. Crucially, aggressive rate hikes make the fiscal arithmetic worse, not better.
Therefore, every soft data point that gives the hold faction a defensible rationale is, in structural terms, a reason for the Fed to wait. Gold is not rising because inflation is fixed. It is rising because markets are pricing the probability that the Fed cannot tighten as aggressively as the three dissenters want. Importantly, that probability does not diminish regardless of what Tuesday’s minutes say. It is baked into the balance sheet arithmetic. Gold sits outside this system entirely, which is why the structural case does not depend on any single data release.
Watch the University of Michigan August preliminary sentiment reading today at 10:00 a.m. ET, and track the live gold price today to follow how markets respond in real time.
Stay On Top of Gold & Silver Prices
Get important market alerts sent straight to your inbox.
SOURCES
1. Bureau of Labor Statistics — Consumer Price Index Summary, July 2026 (released August 12, 2026). bls.gov/cpi
2. Bureau of Labor Statistics — Producer Price Index, July 2026 (released August 13, 2026). bls.gov/ppi
3. CME Group FedWatch Tool — September 2026 FOMC rate probabilities, as of August 14, 2026, via Yahoo Finance. finance.yahoo.com
4. Federal Reserve — FOMC Statement, July 29, 2026; FOMC Minutes release schedule, August 19, 2026. federalreserve.gov
5. GoldSilver — Live Gold and Silver Spot Prices, August 14, 2026. goldsilver.com/price-charts/
6. University of Michigan, Surveys of Consumers — July 2026 final reading (55.2); August 2026 preliminary schedule. sca.isr.umich.edu
7. LiteFinance — Gold Price Forecast and Analysis, August 14, 2026 (FOMC minutes release calendar). litefinance.org
Disclaimer: This article is for informational purposes only and does not constitute investment advice. Past performance is not indicative of future results. Always consult a qualified financial advisor before making investment decisions.
You May Also Like:
- Jackson Hole Is 14 Days Away. What Warsh Says Could Move Gold More Than Any Inflation Print.
- Gold Hit a Two-Month High. Then It Pulled Back. The PPI Data That Caused Both Moves Is What Matters.
- Two Soft Inflation Prints. Gold Is Still Below $4,500. One Number Is Keeping It There.
- China Bought the Most Gold Since 2023 in July. Here’s Why.
- Five Unrelated Forces All Moved Gold and Silver Higher Today. That Doesn’t Happen Often.
- Gold Climbs 1% Ahead of July CPI. Here Is Why the Print Matters More Than the Number.