Daily News Nuggets | Today’s top stories for gold and silver investors
March 13th, 2026 | Brandon Sauerwein, Editor
Gold in Wartime: Not Following the Script
The Iran war’s impact on oil and gold has defied every expectation. Gold is supposed to surge in wartime. That’s the script — especially when the Iran war is driving oil prices higher and rattling global markets. When the U.S. and Israel struck Iran on February 28, it did — briefly. Prices jumped from $5,296 to $5,423 per ounce in days. Then they dropped more than 6% by March 3, even as bombs were still falling.
Two weeks in, with the Strait of Hormuz effectively closed and oil above $100 a barrel, gold is trading in a $5,050–$5,200 range. Sideways. Unimpressed.
So what’s going on? The short answer: a stronger dollar, fading Fed rate cut expectations, and forced liquidations as investors sell winners to cover margin calls elsewhere. When panic selling hits portfolios broadly, gold isn’t immune — it just gets sold alongside everything else to raise cash. The war premium got priced in fast, then unwound faster.
The longer answer matters more: this is what paper gold does. It trades like a risk asset when risk assets crack. Physical is a different story.
Stay Ahead with Gold & Silver News The most important market insights, Fed updates, and global trends — everything investors need to make smarter, safer decisions.
What the Iran War Means for Oil, Gold, and the Fed
The timing of this crisis matters. The latest revision shows the U.S. economy was already slowing before the Iran conflict escalated. Q4 GDP growth was revised down to 0.7% annualized, reflecting weakness across spending, exports, and government outlays.
Yet core inflation remains near 2.7%. Now oil is approaching $100 a barrel.
That combination creates a policy trap. The Fed can’t cut rates into an energy-driven inflation surge — but tightening policy risks pushing a weakening economy into something worse. That’s stagflation. And the data suggests the economy walked into it before the first missile flew.
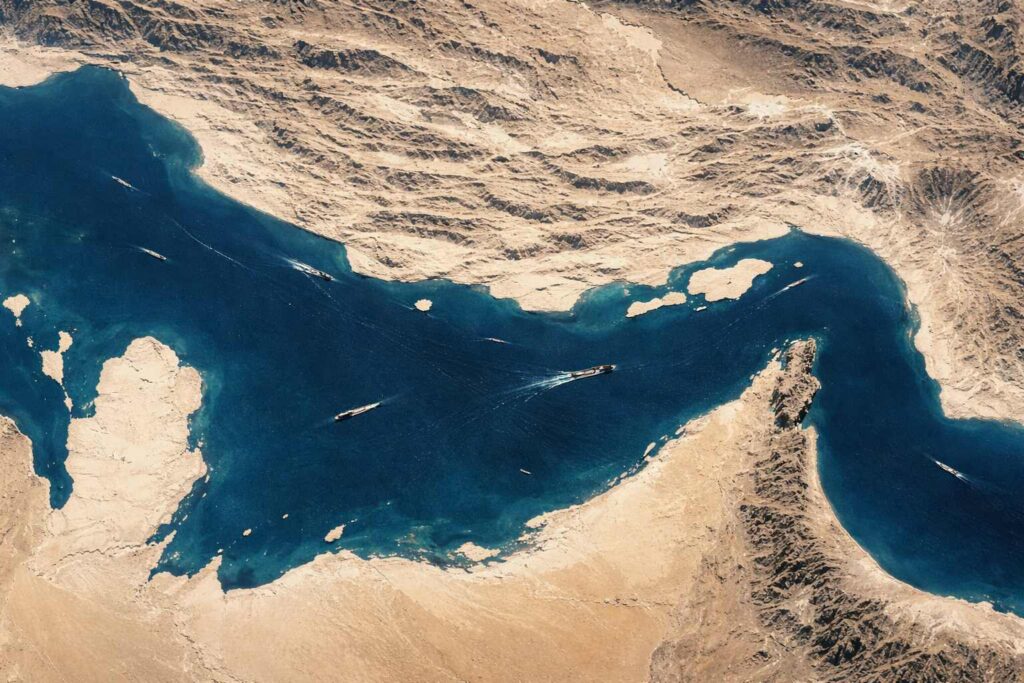
The World’s Most Dangerous Bottleneck
The Strait of Hormuz is 21 nautical miles wide at its narrowest point — roughly the distance from Midtown Manhattan to JFK Airport. Before February 28, around 138 vessels transited it on an average day. Right now, that number is approximately two.
The scale of what that means is hard to overstate. Around 20 million barrels of oil per day — about 25% of all seaborne oil trade — transited the Strait in 2025, which is why the Iran war’s impact on oil and gold markets is being watched so closely. It also carried nearly 20% of global Liquefied Natural Gas. There are no alternative routes for that gas.
Emergency responses have been swift and insufficient. The IEA authorized a record 400-million-barrel reserve release. Saudi Arabia’s primary bypass route can realistically load around 3 million barrels per day. Before the war, Saudi Arabia alone was exporting 6 million barrels through the Strait daily. The math doesn’t close.
It isn’t missiles that closed the Strait. It’s the actuarial tables. War-risk insurers pulled coverage. Without insurance, no shipowner sends a vessel through.
Blank Check for Iran War
Washington is signaling that cost won’t drive military decisions. U.S. Treasury Secretary Scott Bessent said there is no price tag that would make a war with Iran unaffordable — national security comes first.
Markets are still processing what that means. Oil above $100 is already pushing up transportation and production costs across the economy. Inflation, which was finally cooling, has a new tailwind.
The bigger issue is fiscal. The U.S. was already running deep deficits before the first strike. Interest costs on federal debt recently surpassed defense spending for the first time in modern history. Now add a war with no defined endpoint.
It’s a pattern that students of monetary history will recognize. Empires don’t typically fall from a single blow. They overextend — through military campaigns, mounting obligations, and the slow erosion of the currency used to pay for all of it. The bill always comes due. It just rarely arrives on schedule.
More spending, stickier inflation, a Fed with limited room to cut — hard assets tend to do well in that environment. They always have.
The Fed’s Impossible Math
Before February 28, the Fed’s path looked relatively clear. A slowing economy, cooling inflation, two rate cuts priced in for 2026. Then oil crossed $100 a barrel.
The Iran conflict has handed the Fed a problem it hasn’t faced in years: inflation and weakness at the same time. Higher energy prices push consumer prices up. A rattled market and softening GDP pull the other way. The Fed can’t fix both. Cut rates and you risk embedding the oil shock into broader inflation. Hold — or raise — and you risk tipping a slowing economy into something worse.
Today’s data makes the problem concrete. Q4 GDP came in at just 1.4% annualized — down sharply from 4.4% the prior quarter. Michigan Consumer Sentiment drops this morning. It’s the first read since gas prices started climbing, and it may show households already feeling the squeeze.
This is the setup worth watching. The Iran war’s impact on oil and gold is now colliding with the Fed’s already complicated calculus. But stagflation — slowing growth, sticky inflation, a Fed with no good options — is historically one of gold’s strongest environments. The script may just be running on a delay.
Investing in Physical Metals Made Easy