


Select Your Metal
Investment Amount
0 USD
Time
0 Years
Invested Amount
$ 0
Gain/Loss
$ 0
Total Return
$ 0


News
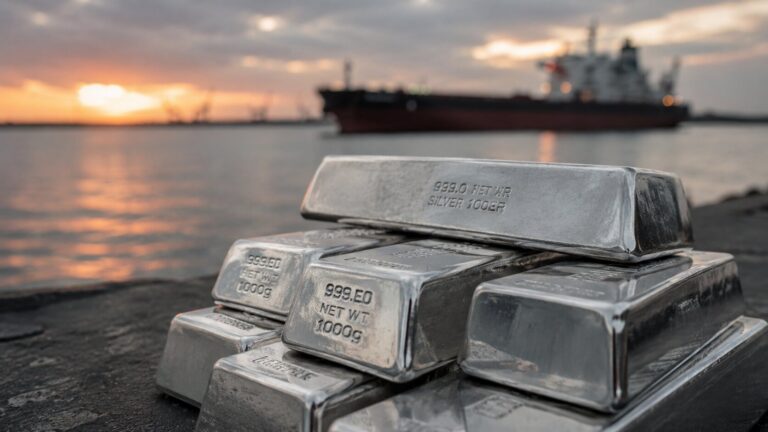
Trump’s Hormuz Toll Is an Inflation Tax. Here’s Why Gold Fell.
Trump’s 20% Hormuz toll sent oil higher and gold to $4,005. Here’s the exact four-step mechanism connecting a shipping levy to a falling gold price — and why the same inflation it creates is the long-term case for owning physical metal.

Articles
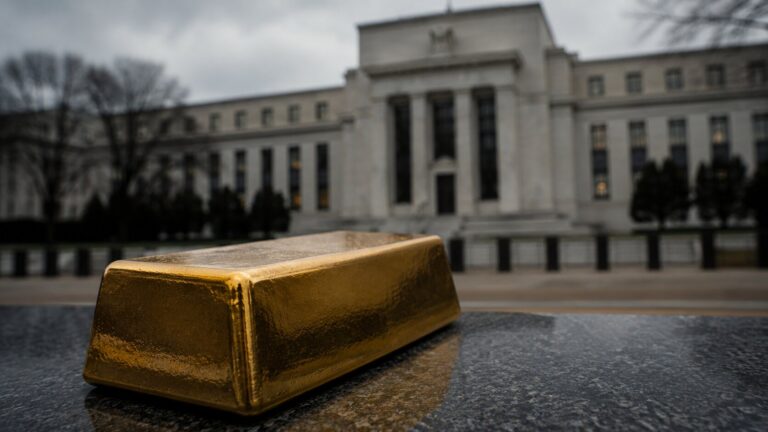
Gold Price Outlook July 2026: The Price Fell. Case Intact.
Gold trades 28% below its January record as Fed rate-hike expectations weigh on real yields. The structural case — central bank buying, fiscal expansion, reserve diversification — has not reversed. Here is what the macro picture means for gold holders in July 2026.

News
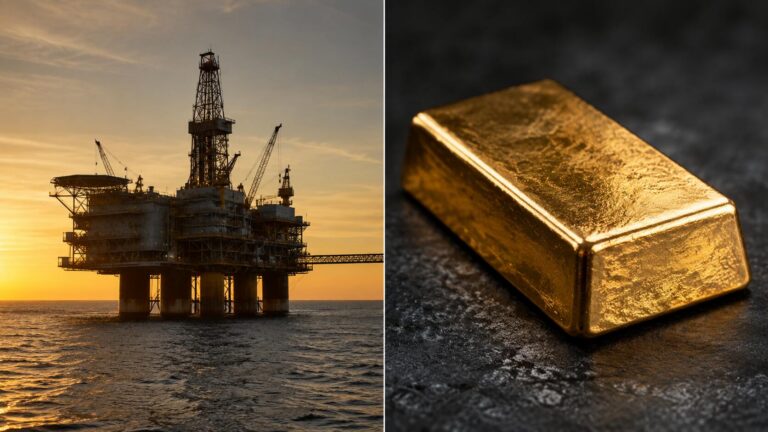
Gold Fell 1.4% on an Iran Strike. One Number Tomorrow Morning Could Change Everything.
Gold is down 1.4% today on fresh Iran strikes. The same real yield mechanism driving gold lower could reverse at 8:30 AM tomorrow. Here is exactly how it works.
