Gold/Silver Price Chart
The gold/silver ratio (GSR) is the current price of an ounce of gold divided by the current price of an ounce of silver.
Home / Price Charts / Gold/Silver Ratio Price Charts
Gold/Silver Ratio Live Price
Gold / Silver Ratio Guide
The gold / silver ratio. It’s simple: Take the price of an ounce of gold and divide it by the price of an ounce of silver. Presto; the resulting number is the gold / silver ratio.
The ratio is most useful at its extremes. When the ratio has topped 80, it has signaled a time when silver was relatively inexpensive relative to gold. Silver went on to rally 40%, 300%, and 400% the last three times this happened.
Likewise, the three times the gold / silver ratio has fallen below 20 in the past, it has marked a period when gold was relatively inexpensive compared to silver.
This is the best of savvy investment strategy; take a simple mathematical equation and track historical price behavior. When relative valuations hit extremes and then revert to historical means time and time again, we seek to buy these temporary undervaluations and wait for their inevitable pendulum swing in the opposite direction.
Gold Price
Silver Price
Explore ourGold / Silver Products
Explore our Latest Insights
Calculated Return on Investment Metals
Select Your Metal
Investment Amount
Time
Invested Amount
$ 0
Gain/Loss
$ 0
$ 0
$ 0
$ 0
Total Return
$ 0
$ 0
$ 0
$ 0
Frequently Asked Questions
What Is the Gold/Silver Ratio and Why Is It Important?
The gold/silver ratio represents the number of silver ounces needed to purchase one ounce of gold. This ratio is a key metric watched by precious metals investors and traders to identify potential investment opportunities.
Calculation: Gold/Silver Ratio = Price of Gold per Ounce ÷ Price of Silver per Ounce
What is the Typical Gold/Silver Ratio Throughout History?
Throughout history, gold has consistently commanded a higher value than silver, with the ratio fluctuating significantly over time
- In ancient civilizations, the ratio was often fixed at 12:1 or 15:1
- During the modern era (post-1900), the ratio has generally oscillated between 50:1 and 80:1
- Extreme readings have occurred: the ratio reached nearly 100:1 during the 2020 market turbulence and fell to almost 20:1 in 1980
How Do Investors Use the Gold/Silver Ratio Today?
The gold/silver ratio is a practical tool for precious metals investors. Traders use it to time their entry and exit points, particularly when the ratio reaches extreme levels. Investors also use it to make strategic decisions about rebalancing their precious metals holdings – often buying silver when the ratio is high and gold when it’s low. Additionally, significant movements in the ratio can signal broader market stress or economic uncertainty, making it a useful indicator for portfolio management.

News and Updates on Gold Market

Hot PCE, Stalling Growth, and an Oil Crisis That Isn’t Over
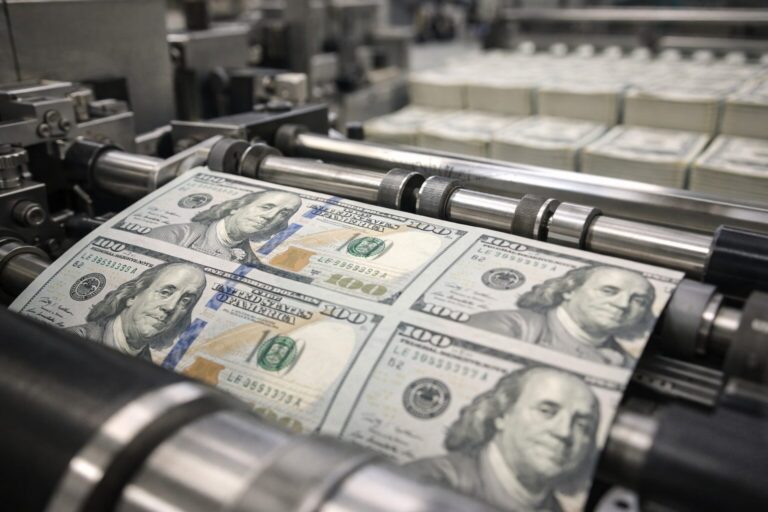
PCE inflation came in at 2.8% year-over-year in February — above the 2.6% forecast and unchanged from January. Combined with near-stalled Q4 GDP growth and an unresolved energy crisis, today’s data paints a complicated picture for the Fed and a familiar one for gold.

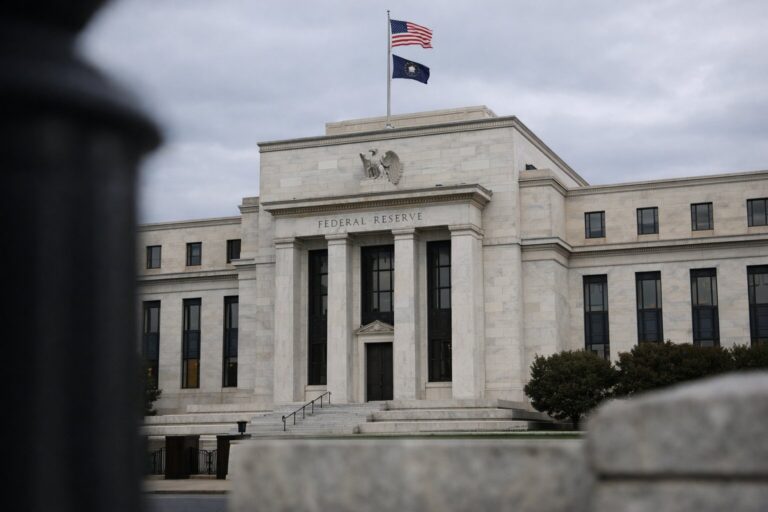
The Fed Is Stuck. Here’s What That Means for Gold.
Iran’s parliamentary speaker says the U.S. violated the ceasefire within hours. Fed minutes show policymakers split on cuts vs. hikes. And gold has historically moved when the Fed can’t signal its next step — a pattern playing out right now.

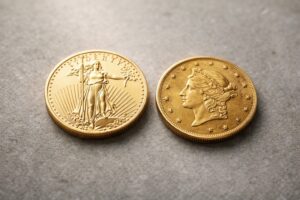
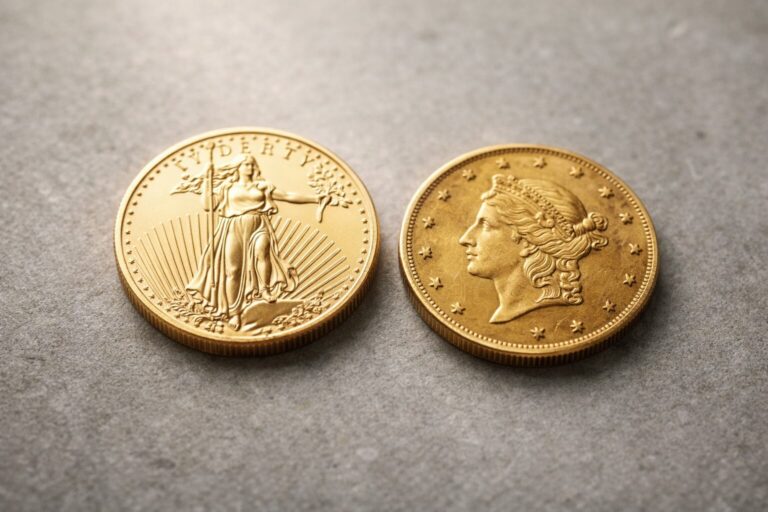
Numismatic vs. Bullion Coins: Know What You’re Buying
Not all gold and silver coins are created equal. The numismatic vs. bullion coins decision shapes what you pay, how easily you can sell, and how directly your investment tracks the metal itself. Here’s a clear breakdown of both — and what belongs in a serious portfolio.


