
Can Stablecoins Save the Dollar? Why Central Banks Are Betting on Gold Instead
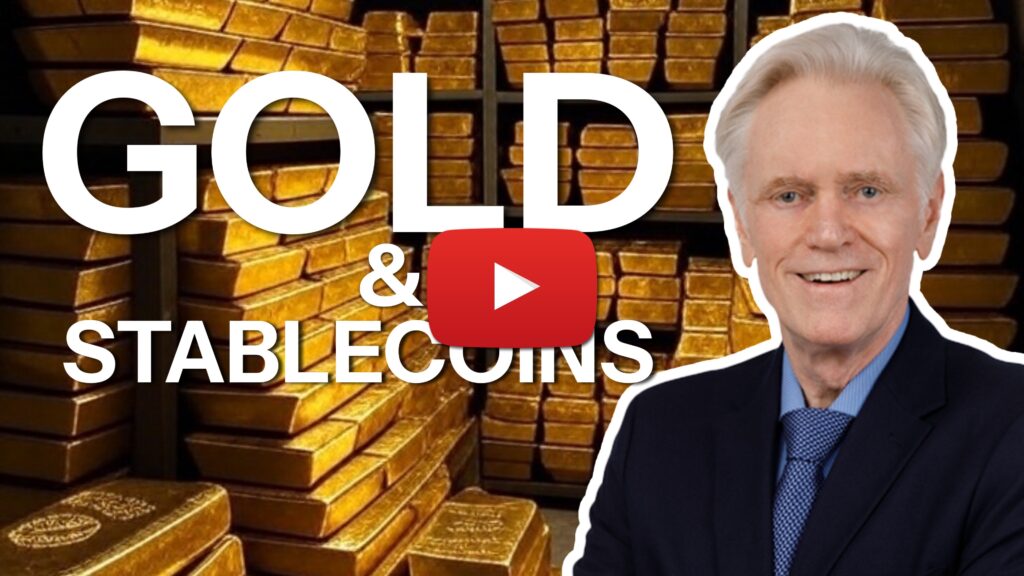
The financial world is witnessing an unprecedented shift. Professional traders are shorting the U.S. dollar at levels not seen in 20 years, while central banks buying gold at record rates signal a deeper loss of confidence in fiat currency. In a recent episode of The GoldSilver Show, Mike Maloney and Alan Hibbard dissect this dramatic transformation and expose why the Treasury’s proposed “stablecoin solution” may be nothing more than wishful thinking. Everyone’s Betting Against the Dollar—But Should They Be? According to the latest Bank of America fund manager survey, professional traders are shorting the dollar in near-record amounts. As Mike […]
Gold and Dollar Rising Together: The “Impossible” is Happening

At the recent Rebel Capitalist Live event in Orlando, Mike Maloney sat down with Brent Johnson of Santiago Capital to explore a surprising trend: gold and the dollar rising together. Known for his contrarian Dollar Milkshake Theory, Johnson challenges the conventional belief that these two assets can’t move up in tandem. Most investors operate under a simple assumption: when gold rises, the dollar falls, and vice versa. But according to Johnson, we’re witnessing something that many consider impossible — both assets rising simultaneously. The Dollar Milkshake Theory in Action “Fiat currency loses value over time — that’s just the nature […]
Now Could Be the Best Time to Buy Silver in Years: Here’s Why…
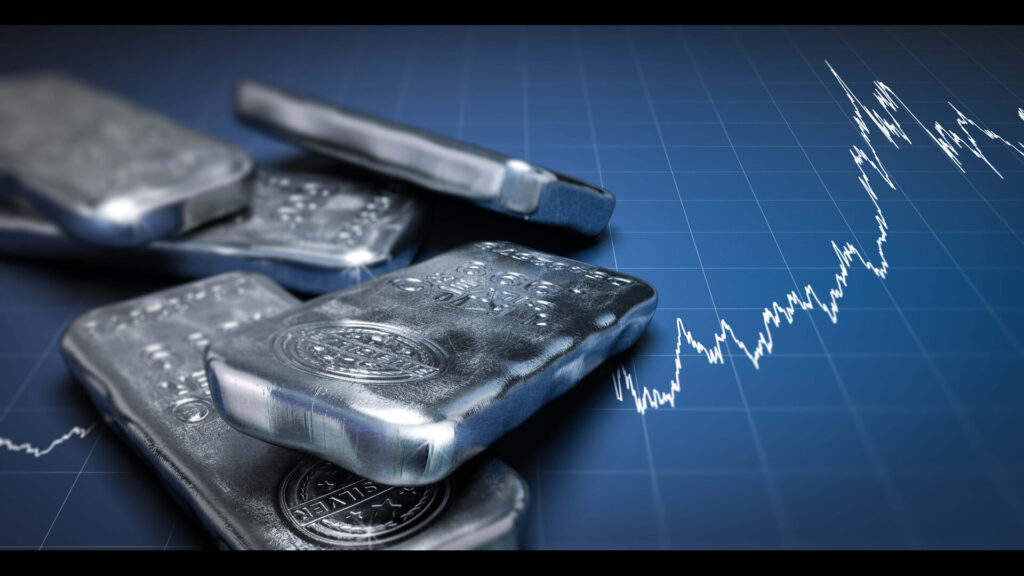
After 15 years of formation, silver’s massive cup and handle pattern is now signaling an imminent breakout that could send prices soaring.
Silver’s $50 Breakout: The Biggest Precious Metals Run in History?
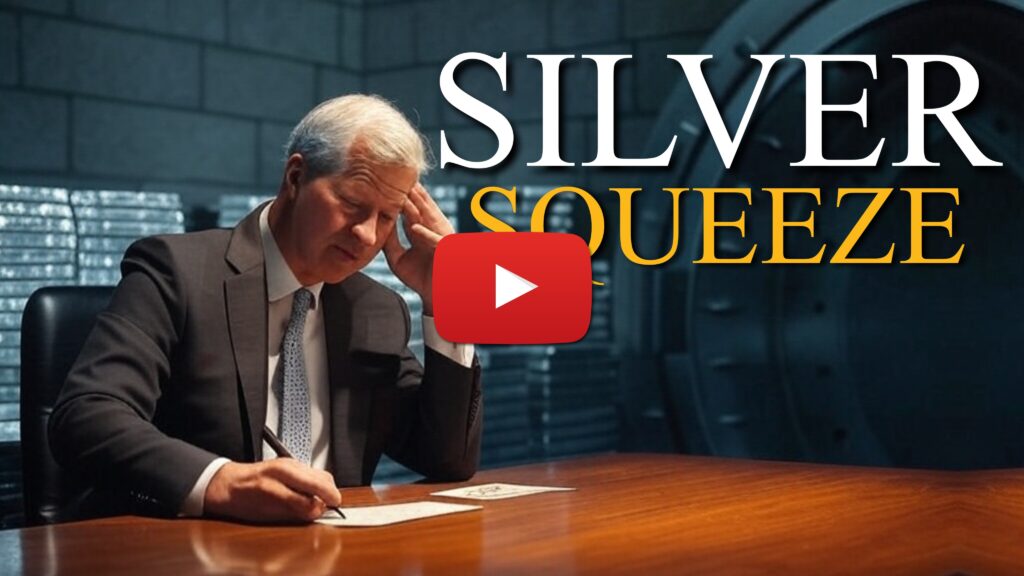
In this eye-opening video, Mike Maloney reveals the explosive factors converging in the silver market: historic short positions, a colossal cup and handle pattern, and decades of currency debasement.


