Why Is Silver Down 5%? The Gold-Silver Ratio Explains.
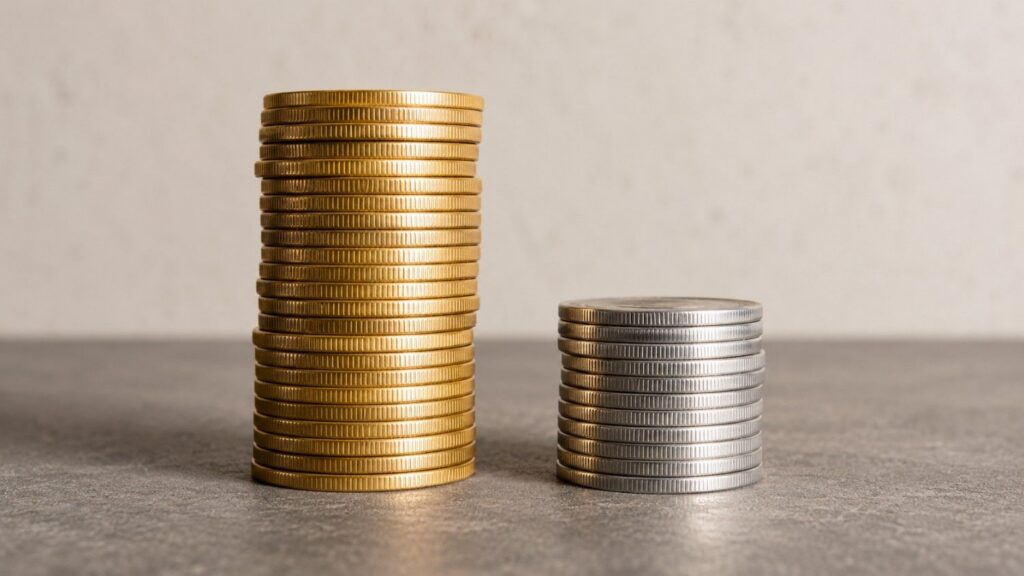
Gold is down 1.7% today. Silver is down 5.4%. The gold-silver ratio just hit 67 — and it’s not a valuation signal. It’s a real-time diagnostic of two forces colliding: the Iran peace dividend versus the Fed’s rate-hike threat. Here’s which one is winning, and why Thursday’s PCE report is the swing factor.
Half the Fed Wants a Hike. 45% of Central Banks Are Buying More Gold.

The Fed’s June 2026 dot plot split the committee down the middle on rate hikes, the dollar surged to its highest since May 2025, and silver posted its sharpest drop in weeks before recovering nearly 70% of the loss. The same week, the World Gold Council reported a record 45% of central banks plan to add gold. The headwinds are real. So is the floor.
Silver Hit $69.85 This Morning. Then the FOMC Took It All Back.
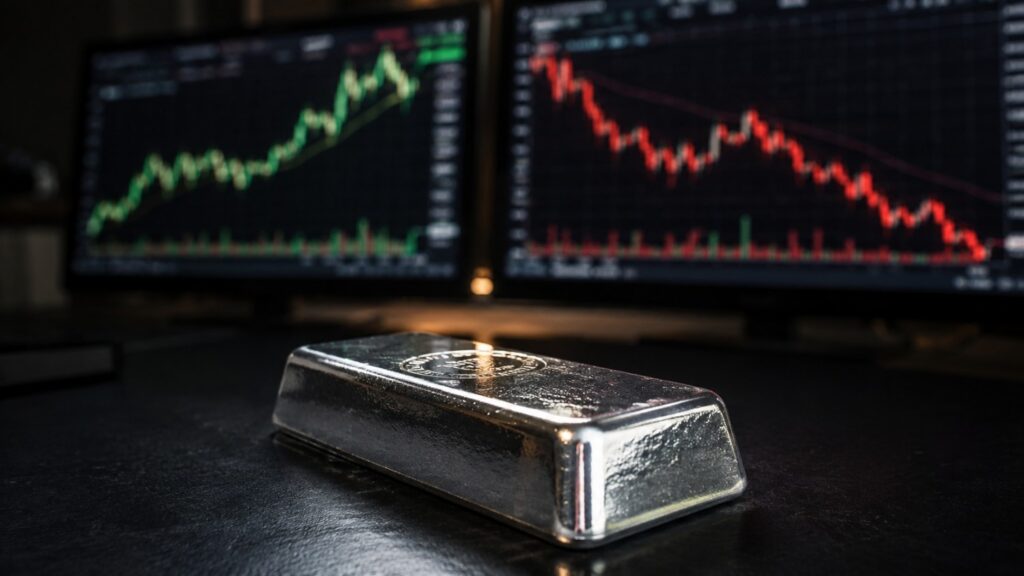
Silver climbed 2.8% on the Iran peace deal this morning, then gave it all back as the FOMC’s rate-hike signal reasserted itself. Gold barely moved. The gap between the two metals today shows exactly why silver behaves differently — and what physical holders need to understand about both forces.
The Fed Went Silent. Gold Holders Don’t Need It to Speak.
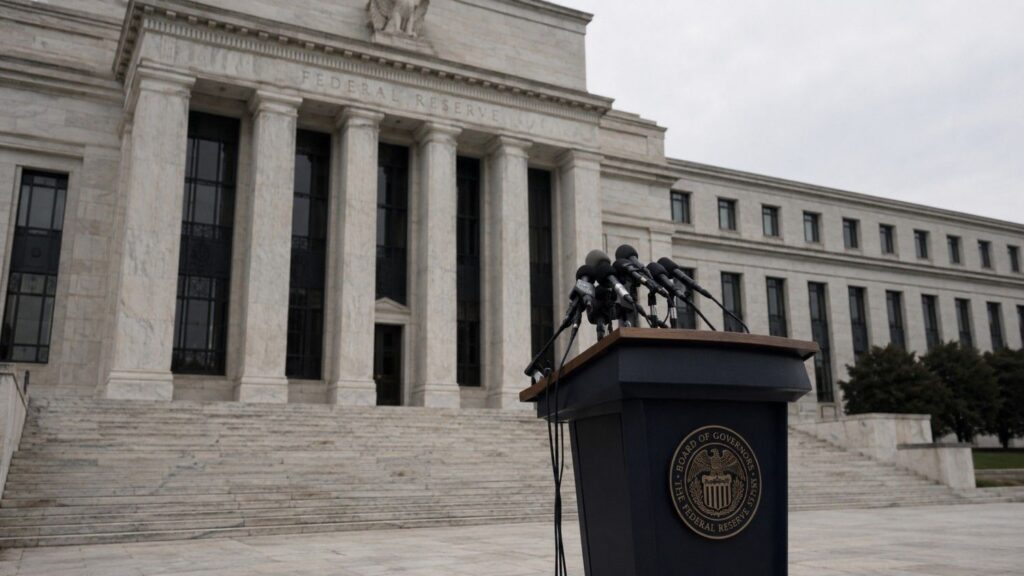
Kevin Warsh scrapped forward guidance and skipped the dot plot at his first Fed meeting. Paper gold fell 2%, then recovered. Here’s why the biggest shift in Fed communication since 2008 leaves the structural case for physical gold exactly where it was.
The Fed Just Killed Its Rate Roadmap. Here’s What That Means for Gold.
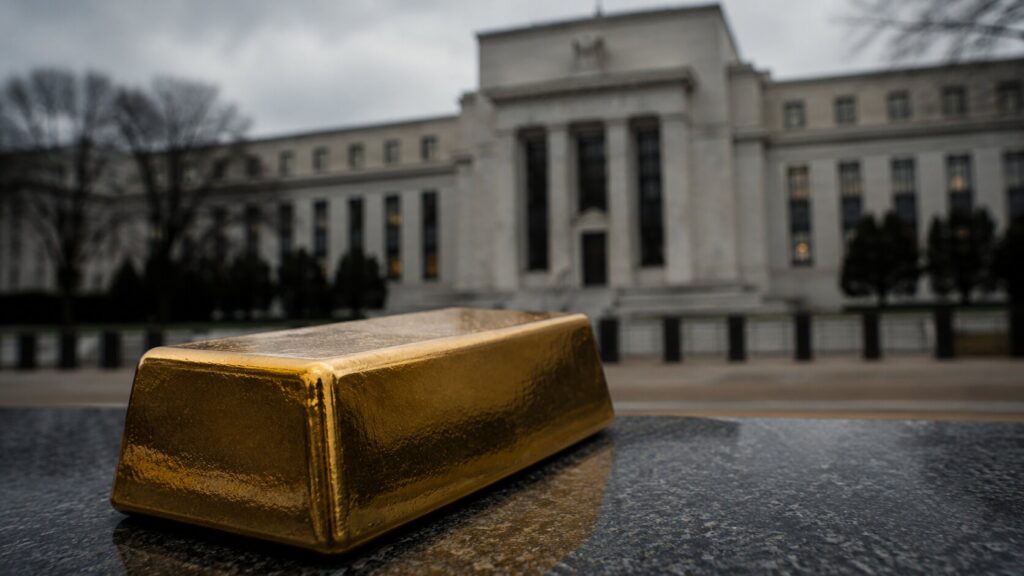
The Fed held rates steady. That wasn’t the story. Kevin Warsh withheld his dot plot entry — the first Fed chair in 14 years to do so — and quietly ended the forward guidance era that has guided markets since 2012. Here’s what that shift means for gold.
Why Is Silver Up Today? The Iran Deal Changed the Fed Math
Silver is up while oil burns down. Most headlines are calling it a peace trade. They have the mechanism backwards. The real driver isn’t the war ending — it’s what cheaper oil does to Fed rate-hike expectations, real yields, and silver’s opportunity cost. Here’s the chain most coverage is missing.
Every Bearish Catalyst Landed at Once. Gold and Silver Went Up Anyway.

Every bearish macro catalyst landed today at once — hot PPI, an ECB rate hike for the first time since September 2023, and a second night of US-Iran strikes. Silver opened at its lowest level since December 2025. By afternoon it was up 3.6%. Here’s what that market signal means for physical holders and what to watch before the FOMC on June 17.
Gold at Seven-Month Lows: Why Geopolitical Fear Is Not Enough

The Iran war should be pushing gold higher. Instead it is pushing the Federal Reserve toward rate hikes, suppressing the very safe haven the conflict should be lifting. Here is the mechanism behind five stories moving gold and silver today.
Gold Price News: Goldman, China, CPI, and the Fed Explained
Goldman Sachs just pushed every 2026 rate cut to 2027. China’s central bank bought gold for the 19th month in a row. CPI drops Wednesday. A fragile ceasefire is holding — barely. And silver just had its worst week relative to gold in months. Here is what each story means for precious metals investors.
Gold Holds $4,481 With Rate Hike Risk Rising. Here’s the NFP Decision Map.
Gold is holding near $4,481 with rate hike risk rising — a divergence that, in any prior rate cycle, would have already sent gold lower. Tomorrow’s May jobs report is the last major data point before Warsh’s first FOMC meeting June 16–17. Here’s the three-scenario decision map: what a hot print, an in-line print, and a soft miss each mean for gold — and why the Fed’s policy trap makes the structural case for sound money regardless of Friday’s number.
