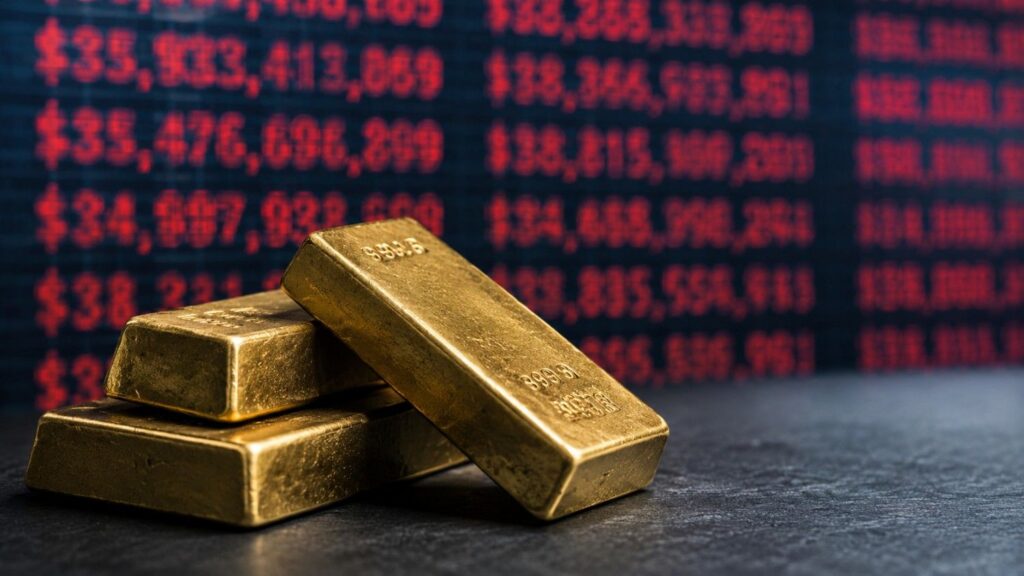
Gold Rate Hike Fears Are Weighing on Prices. Here’s the Full Picture.

Gold slipped to $4,448 this week as rate-hike fears and Middle East tensions drove a 2% weekly loss. Central banks bought 244 tonnes in Q1 2026 — yet retail demand has cooled sharply. With May jobs data due today and gold holding just above its 200-day moving average, here is what five key developments mean for anyone holding precious metals right now.
Central Banks Picked Gold Over Treasuries. Should You?
The ECB just confirmed gold leads global reserves for the first time since 1996 — ahead of US Treasuries. Central banks that could have rebalanced didn’t. Here’s the mechanism behind that choice, and what it means for individual savers.
Silver Lost 3.3% While Gold Lost 1.6%. That Gap Is Not Random.
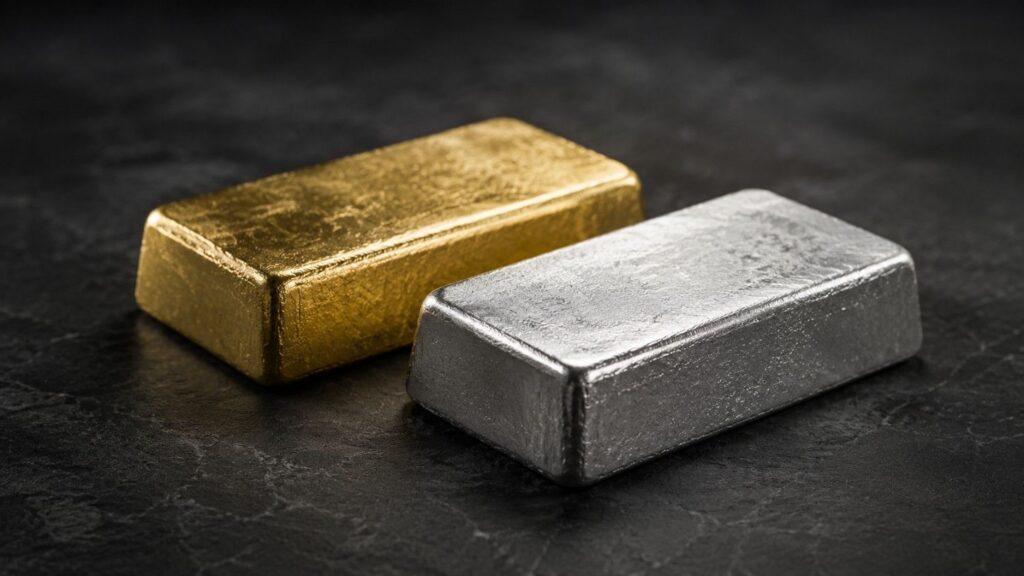
Silver is falling more than twice as fast as gold today. The reason isn’t panic — it’s structure. Here’s the three-part mechanism behind silver’s amplified moves, and what six consecutive supply deficit years mean for long-term holders.
Trump Called Off the Strike. Gold’s Real Risk Is Still $39 Trillion.
Trump’s decision to pause a planned Iran strike sent gold swinging $45 intraday and crude oil down more than 2% — but the two metals told completely different stories. Oil priced out the geopolitical risk. Gold barely moved. Five briefs explain why: Iran is the catalyst, not the cause. The monetary fundamentals driving gold — $39 trillion in national debt, fifteen years of money creation, central banks in their fifteenth straight year of net buying — don’t get resolved by a phone call.
Silver vs. Gold: A Clear 5-Year Investment Guide (2026–2031)

Gold has crossed $5,000. Silver has broken $100. With precious metals at historic highs, the silver vs gold investment debate has never been more relevant. This guide breaks down risk profiles, industrial demand, price forecasts, and portfolio allocation strategies to help you decide how to position your precious metals holdings for 2026–2031.
Oil Crashed 11%. Gold Went Up. That Tells You Everything.

Oil crashed 11% on Friday when Iran reopened the Strait of Hormuz. Gold went up. That rare divergence — oil down, gold up, same catalyst — signals that gold’s rally is driven by monetary forces, not geopolitical ones. The war premium left oil. The monetary premium stayed in gold. Here is what that means for precious metals investors watching the Fed’s next move.
Silver Holds Near $80 as Iran Ceasefire Revives Rate-Cut Bets

Silver surged more than 5% Tuesday and is holding near $80 — the highest level since March. The move isn’t simple. When the US and Israel launched their air campaign against Iran, gold fell 10% instead of rising. The reason was oil, the Strait of Hormuz, and an inflation shock that killed rate-cut expectations. The Iran ceasefire is now reversing all three dynamics at once — and silver is responding through both its monetary and industrial demand channels. Here’s the mechanism, the data, and the one date every precious metals investor should have on their radar.
Gold Outranks the Dollar at Central Banks — What It Means for Your Savings
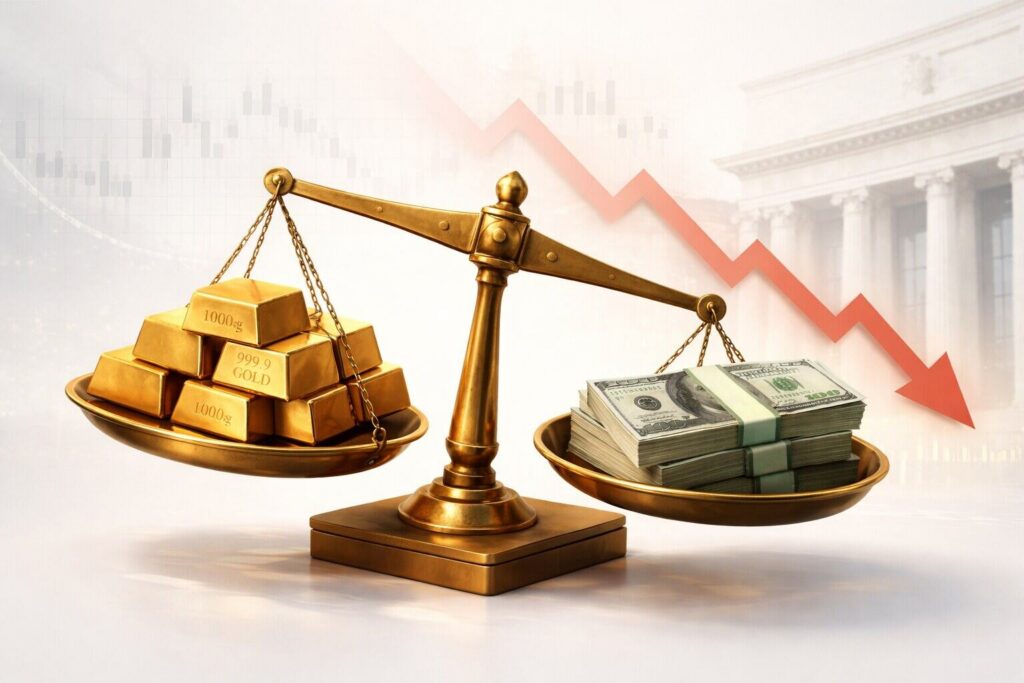
For the first time since the collapse of Bretton Woods, central banks now hold more gold than dollars — $3.87 trillion vs. $3.73 trillion. Here’s what that structural shift means for your savings.
Hormuz Blockade Sent Gold Down 2%. Here’s Why That’s Bullish
The Hormuz blockade sent gold down 2% as oil surged past $100. But margin liquidation — not fundamentals — drove the drop. With CPI at 3.3%, central banks buying, and the petrodollar requiring a navy to defend, the structural case for gold just got stronger.
Iran Ceasefire Sends Gold to $4,800 — Now What?

Gold is pushing toward $4,800 and silver jumped nearly 6% after a U.S.-Iran ceasefire reopened the Strait of Hormuz. But this rally isn’t just about the war pausing — central banks, dollar weakness, and monetary debasement remain the structural bid under precious metals.
