
 Gold-Silver Ratio Hits 100:1 – A Historic Buying Signal for Silver





Gold Has Entered Its Third and Final Stage: Why $10,000 Per Ounce Could Be Coming
For two decades, Mike Maloney has been waiting for this moment. The bestselling author of The Great Gold and Silver Rush of the 21st Century believes gold has just entered the third and final stage of its massive bull market — the stage where it makes its greatest gains in the shortest period of time. “I’ve been waiting a long time for this,” says Maloney, who started investing in gold in 2002 and founded GoldSilver in 2005. “And the evidence is there.” The Three Stages of Gold’s Bull Market According to Maloney’s analysis, every major gold bull market follows three distinct […]
America’s Credit Downgrade: What It Means for Gold
Moody’s just downgraded U.S. debt. Here’s why investors are turning to gold — and why it might be too early to take profits.
“Is it Too Late to Buy Gold?” The #1 Question Right Now
Gold prices are soaring. Headlines are buzzing. And many investors are asking the same thing: “Did I miss my chance to get in?” In his latest video, Mike Maloney unpacks that question — and reveals what’s really behind gold’s recent run. If you’re wondering what happens next, you’re not alone. In this video, Mike covers: If you’re sitting on the sidelines, watch Mike’s new video to get clarity before your next move. So… who’s driving the price up? Institutional Whales Are Quietly Loading Up The Public Hasn’t Even Entered the Game The majority of financial advisors still recommend […]
Gold Hits $3,500 — Why Gold is Up 33% YTD and What’s Next?
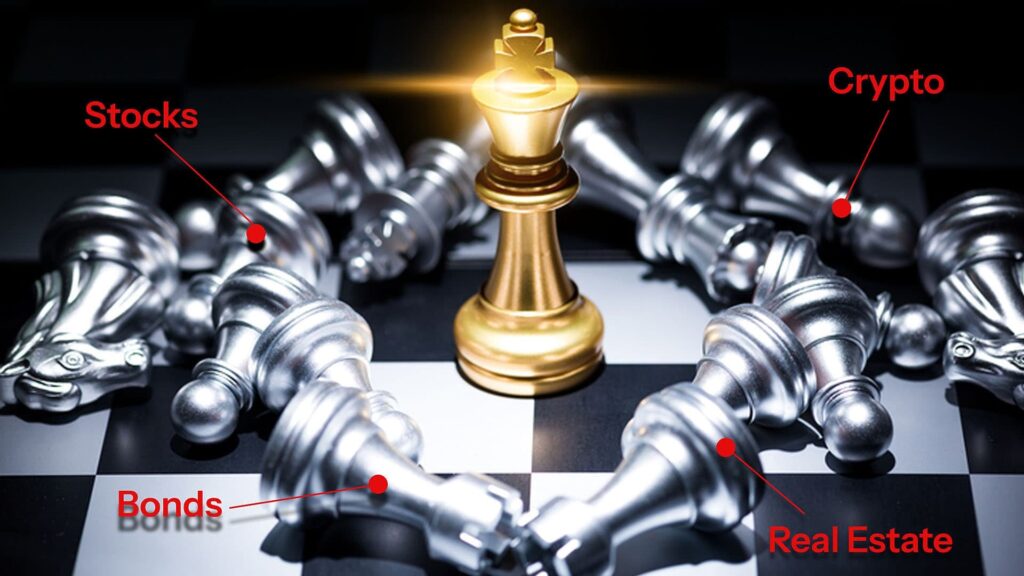
Brandon Sauerwein, Editor Since 2000: Gold +1,088% Returns | SPY +478% Returns What we’re witnessing isn’t just a bull run — it’s a reawakening in precious metals. In just the past month, gold shattered the $3,000 milestone and briefly touched $3,500 an ounce early Tuesday morning — a historic surge that has stunned even veteran investors. But this move isn’t happening in isolation. A perfect storm is unfolding: escalating tariff tensions, ballooning global debt, surging central bank demand (especially from the East), and a growing global shift away from the U.S. dollar are rewriting the rules of gold. Traditional forces […]
Why Smart Investors Are Trading Real Estate for Gold

While housing costs soar in dollars, gold tells a completely different story…
Gold vs. Real Estate: Why Investors Are Shifting to Precious Metals

In this eye-opening video, Alan Hibbard breaks down the data behind skyrocketing home prices, higher interest rates, and shrinking affordability across the U.S.


