 Silver Rises Over 120% YTD




What Is ZIRP (Zero Interest Rate Policy) and How It Changed Gold Forever
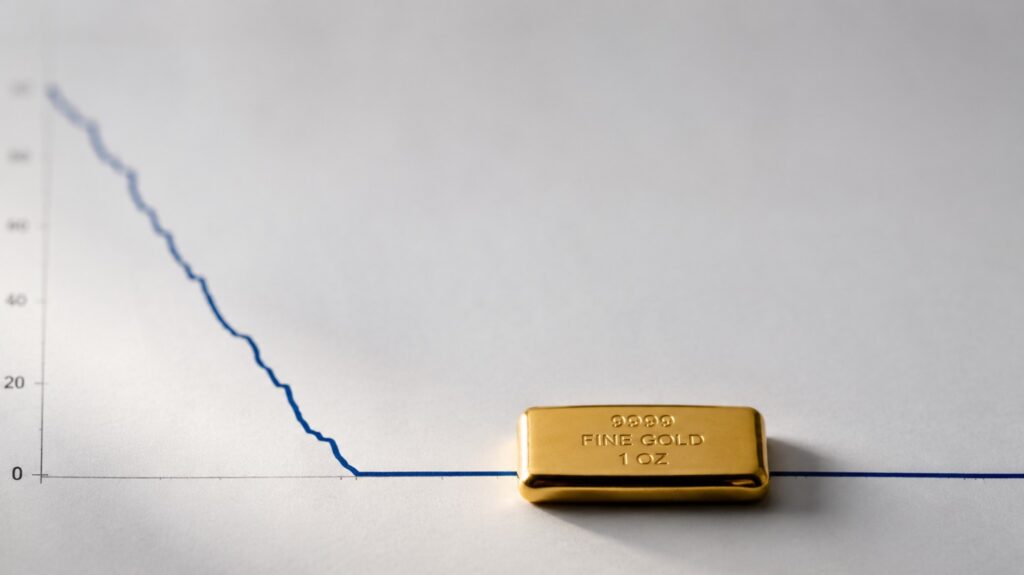
A zero interest rate policy holds the central bank’s short-term target at or near zero. The Federal Reserve did it twice, for nine of fourteen years. But zero rates alone never moved gold. The real policy rate did, and it explains today’s market better than the headline number does.
Two Inflation Numbers Come Out Every Month. The Fed Only Cares About One.
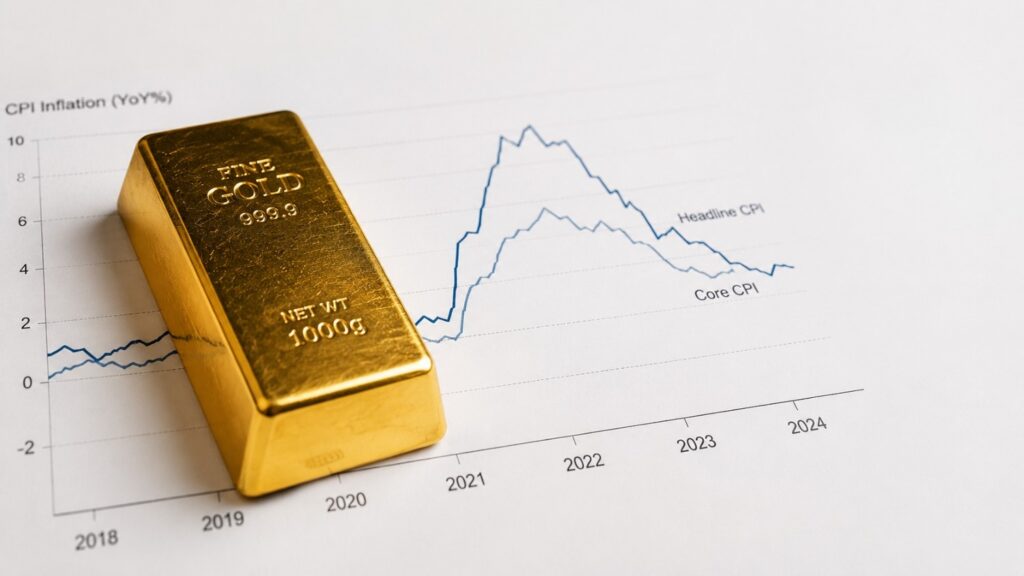
The Fed releases two inflation numbers every month — headline CPI and core CPI. They tell very different stories, and the Fed only acts on one of them. Here is what each measure captures, why the Fed leans on core PCE to set interest rates, and why that gap between what you pay and what the Fed watches matters for gold investors.
The Fed Printed $7 Trillion. Velocity Kept It Quiet. That’s Changing.

The Fed printed trillions. Inflation didn’t follow — not immediately. Here’s the monetary mechanism that kept it quiet, why it’s now reversing, and what the velocity of money chart is signaling for gold investors right now.
China Has Been Buying Gold for 20 Straight Months. Now It’s Moving It.

China’s central bank is quietly moving gold from London to Hong Kong, backing a new clearing system designed to price gold in Asia on different terms.
M2 Money Supply: The Number That Makes Your Portfolio Meaningless
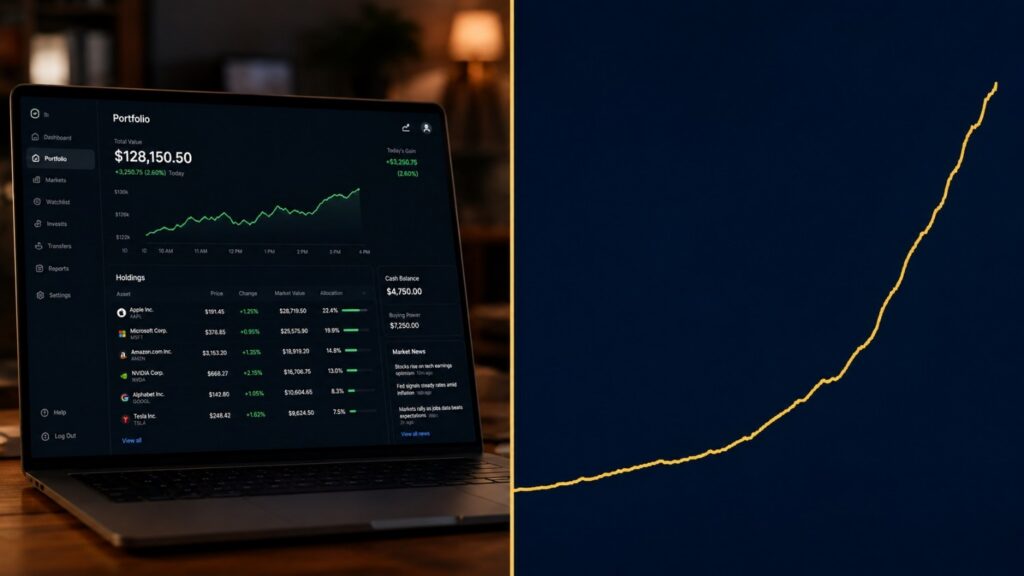
Most investors check their portfolio every day. Very few have ever looked at a chart of M2 money supply. That gap — between what feels important and what actually is — turns out to be one of the most expensive mistakes a long-term saver can make. Here is what M2 is, why it grew 55 percent since 2020, and why it tells you something your portfolio never will.
Why Is Gold So Expensive? The 5 Mechanisms Behind the Price
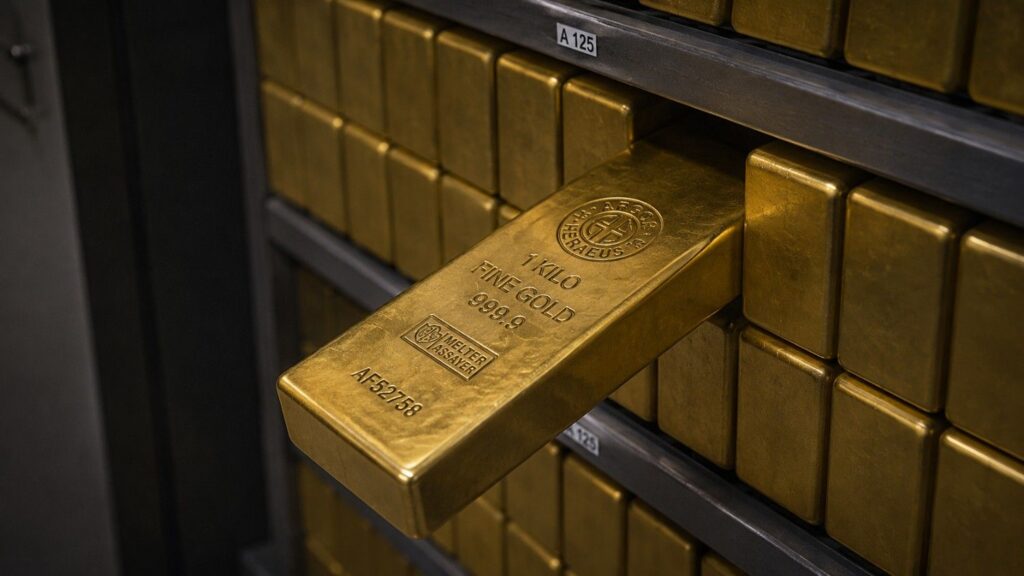
Gold costs roughly $4,000 per ounce today. Here are the five specific, measurable forces that explain exactly why — and why every major bank expects the price to go higher.
What Moves Gold Prices? 6 Key Gold Price Factors Explained
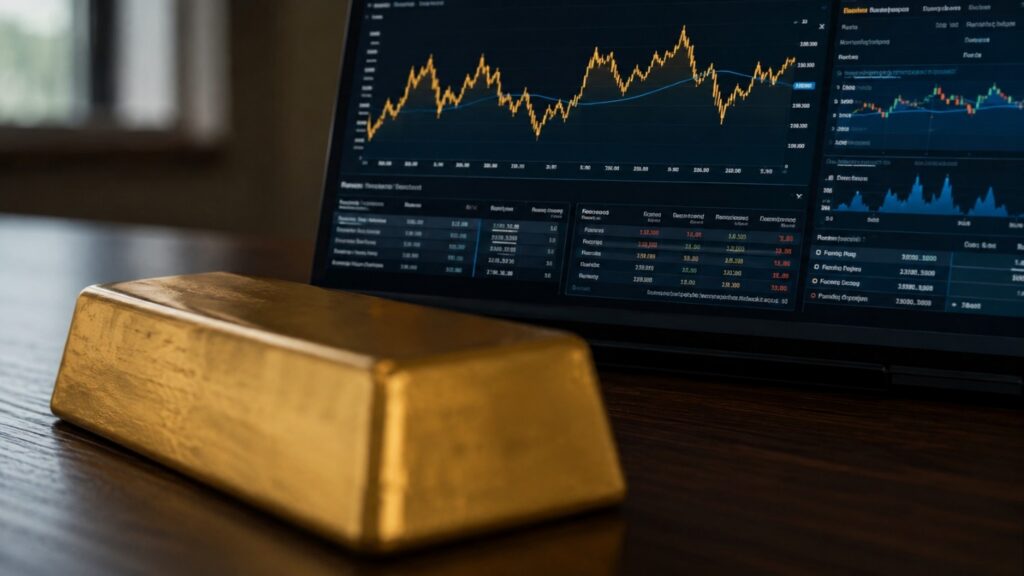
Gold hit an all-time high of $5,589 in January 2026 — then pulled back 18%. Here are the six macroeconomic factors that move gold prices, and why understanding them matters more than tracking the daily chart.
Dollar Dominance Is Fading. Gold and Silver Are Paying Attention.
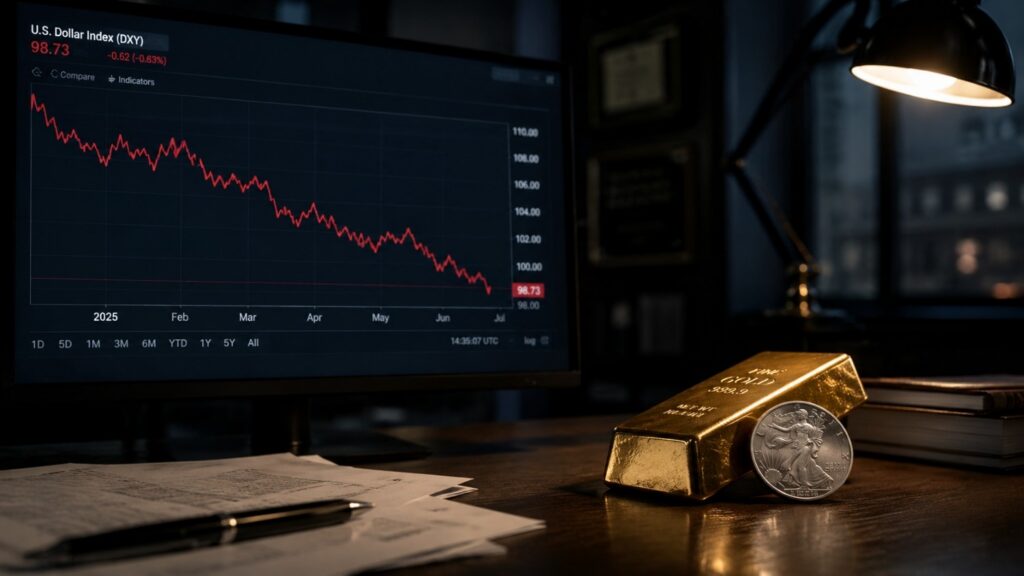
With gold above $4,600 and silver trading at historically unprecedented price levels, one signal explains the move: dollar dominance is fading — and precious metals are the direct beneficiary.
What’s Driving Gold Prices? Oil, PMI, and Newmont

Five market stories from April 23, 2026 — and what they mean for gold and silver holders. From Trump’s Hormuz escalation to Newmont’s cost data, each brief connects today’s news to the structural case for holding physical precious metals.
What Drives Gold Prices? 5 Forces Investors Are Watching Now

Gold peaked near $5,250 in early 2026 and has held firm through war, a Fed leadership crisis, and dollar weakness. Here are the five structural forces explaining why — and what they mean for investors.


