 Silver Rises Over 120% YTD




Gold Price Outlook July 2026: The Price Fell. Case Intact.
Gold trades 28% below its January record as Fed rate-hike expectations weigh on real yields. The structural case — central bank buying, fiscal expansion, reserve diversification — has not reversed. Here is what the macro picture means for gold holders in July 2026.
HSBC Cut Its Gold Forecast by $304. Then Said Gold Will Hit $4,750 by Year-End.
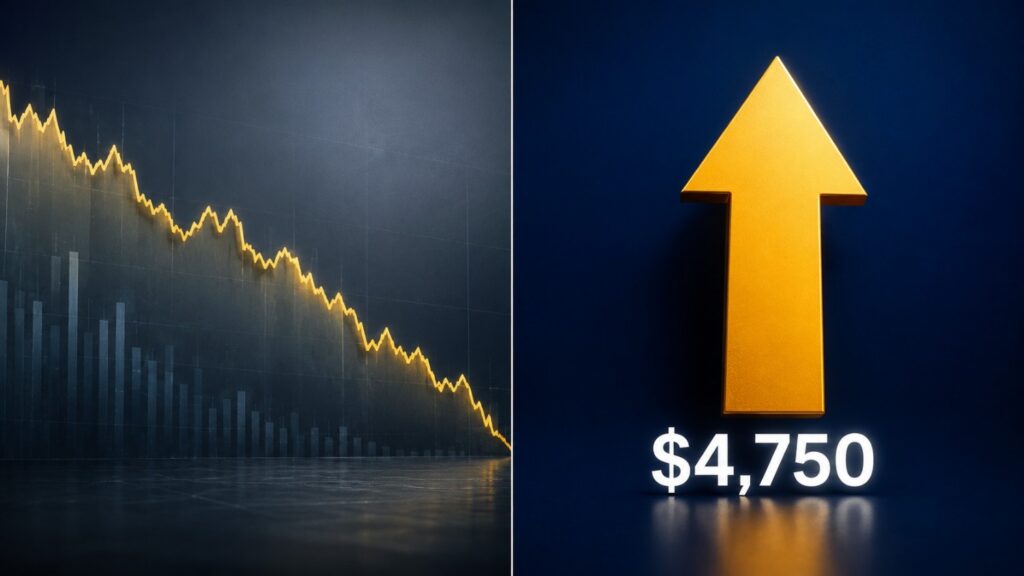
HSBC cut its 2026 average gold forecast to $4,560 from $4,864 on July 9, citing a hawkish Fed and stronger dollar. Its year-end target of $4,750 held — and that’s the number that matters.
Gold Down 26%. Barclays’ $4,791 Target Never Moved.

Barclays held its $4,791 gold target through a 26% correction. Here’s the fair-value framework behind that call — and what it means for gold investors today.
Gold Price Outlook June 2026: What CPI and the Fed Mean

Gold is at ~$4,165 — 25% below its all-time high. May CPI confirmed at 4.2%. With Warsh’s first FOMC on June 16–17, here’s what the data means for precious metals investors.
Gold Surges 1.5%: ADP, ISM, and Beige Book Trap the Fed

Five data points landed Wednesday that should have pressured gold. Instead, gold surged 1.5%. Each event tightens the same Fed trap — and gold trades on the trap, not the direction the Fed falls.
Gold at $4,454 Says the Fed Is Trapped. Here’s Why.
Friday’s jobs report doesn’t just move gold for 48 hours. This time it sets the stage for Kevin Warsh’s first FOMC meeting, a divided committee, and 3.8 percent inflation the Fed can’t cut through. Three scenarios. One structural trap. Here’s the framework before the number drops.
Gold’s Center of Gravity Has Moved East — 5 Stories That Prove It

Incrementum hit its $4,800 gold target four years early. Russia is selling reserves to fund a war. China has bought gold for 18 consecutive months. India holds $3.6 trillion in metal and still imports more. And Citi is calling $5,000 near-term while turning cautious on the medium term. Five events, one signal: the gold market has a new power structure — and the West is still reading the old map.
CPI Hits 3.8%. Gold Falls. The Mechanism Nobody Explains

April CPI just printed 3.8% — the highest reading since May 2023 — and gold is down anyway. A new hawkish Fed chair takes over Friday, the Strait of Hormuz is still closed, and central banks bought through gold’s entire 16% correction from its January high. Here’s what each of those facts actually means for long-term holders.
Gold Price Outlook: Oil Futures Disagree With Stock Markets
The World Gold Council’s April commentary carries a loaded title: “The Return of Transitory.” It’s a warning — equity markets have priced the Iran-Hormuz crisis as a passing shock, but oil futures are pricing a 22–25% premium over pre-crisis levels through year-end. One of those markets is wrong, and that gap is the most important signal in gold right now.
Gold Is Up 41% From a Year Ago. The Fed Can’t Stop It
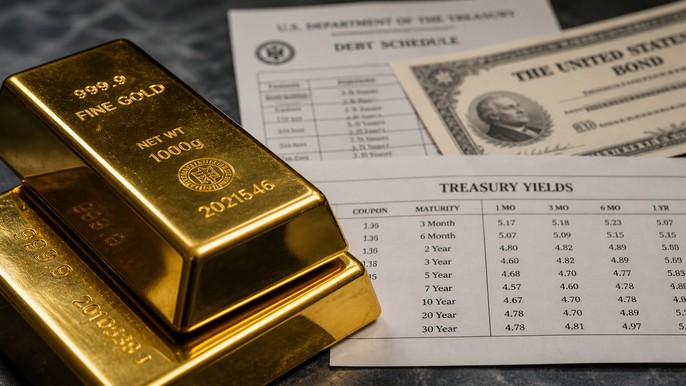
Gold is trading at $4,648/oz — up 41% from a year ago, down 14% from January’s record. Both numbers are true. The one that matters is the 41%. It held through a war, three hawkish Fed holds, and the most fractured FOMC vote since 1992. Here’s why that gap between the record and today’s price is a floor, not a warning.


