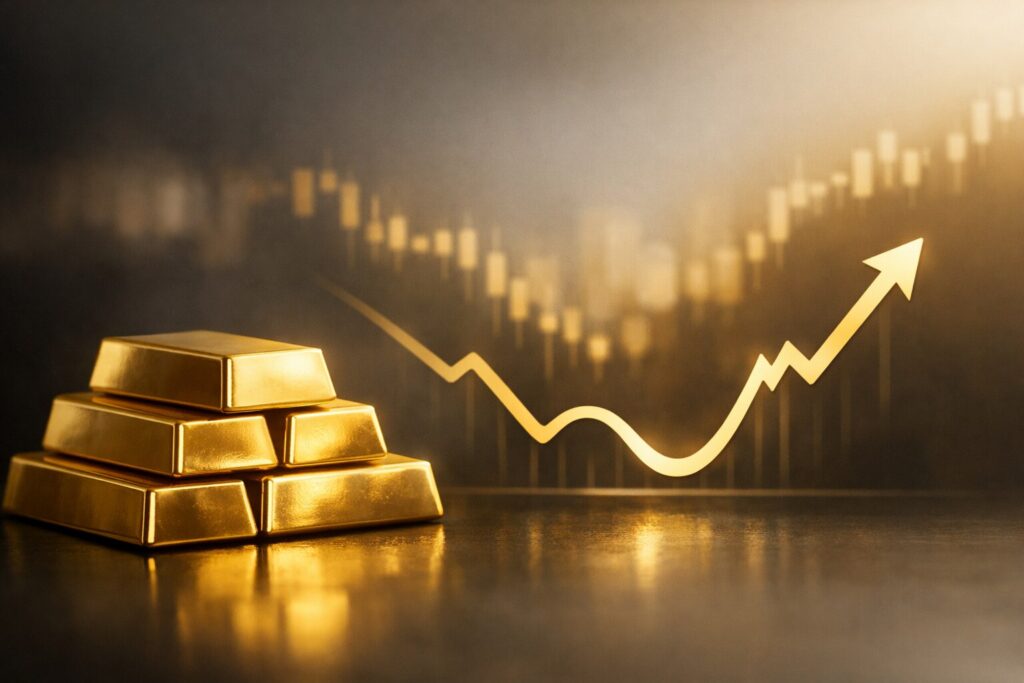
Gold Is Up 41% From a Year Ago. The Fed Can’t Stop It
Gold is trading at $4,648/oz — up 41% from a year ago, down 14% from January’s record. Both numbers are true. The one that matters is the 41%. It held through a war, three hawkish Fed holds, and the most fractured FOMC vote since 1992. Here’s why that gap between the record and today’s price is a floor, not a warning.
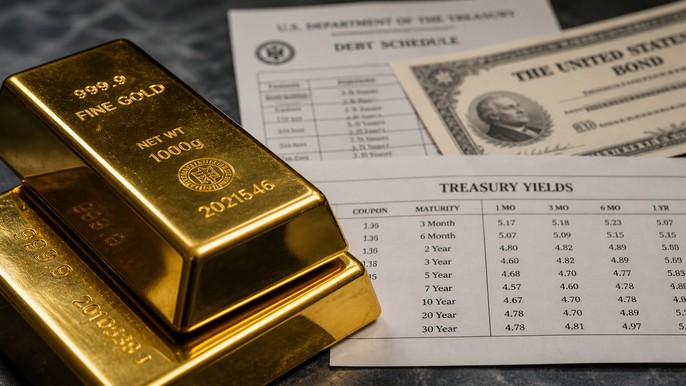
PCE at 3.5%, GDP Miss: Why This Is Bullish for Gold

PCE inflation hit 3.5% in March — the highest since May 2023 — while Q1 GDP grew just 2.0%, missing the 2.2% forecast. Four central banks held rates the same morning, with two signalling they discussed hikes. When growth slows and inflation stays hot, the Fed is trapped. That trap has historically been the strongest environment for physical gold and silver.
Gold Price Today: What to Watch Before the April 29 FOMC

Gold is trading near $4,707 on April 23 as the final pre-FOMC data window closes. Jobless claims came in at 214,000, the dollar is at one-week highs, and Powell’s last meeting as Fed chair is six days away. Here’s what to watch before April 29.
What Drives Gold Prices? 5 Forces Investors Are Watching Now

Gold peaked near $5,250 in early 2026 and has held firm through war, a Fed leadership crisis, and dollar weakness. Here are the five structural forces explaining why — and what they mean for investors.
Gold Price Forecast 2026–2027: Key Predictions from Top Analysts
Gold is 13% below its January all-time high — and every major bank is calling it a buying opportunity. This analysis covers 2026–2027 forecasts from J.P. Morgan, Goldman Sachs, Wells Fargo, UBS, and more, plus the five structural forces driving the rally.
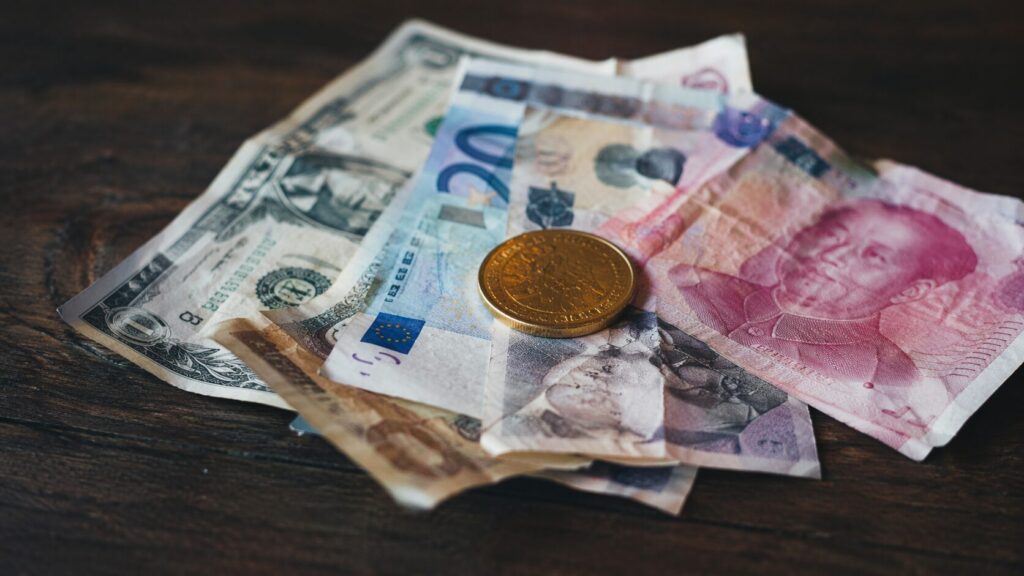
Gold Outranks the Dollar at Central Banks — What It Means for Your Savings
For the first time since the collapse of Bretton Woods, central banks now hold more gold than dollars — $3.87 trillion vs. $3.73 trillion. Here’s what that structural shift means for your savings.
Gold Dip Buying Explained: Is This A Smart Move Now?
Gold set an all-time high of $5,595 per ounce in January 2026 — then pulled back roughly 15% by mid-April. For investors watching from the sidelines, gold dip buying is firmly back in the conversation. But a lower price alone isn’t a strategy. This guide covers what’s actually driving the correction, what central banks and major analysts are forecasting, and how to enter with discipline rather than impulse.
Gold Price Forecasts for 2026, Revisited After Q1

Gold prices are shaped by powerful forces — real interest rates, U.S. dollar strength, central bank demand, and geopolitical risk. This guide breaks down the key drivers behind gold future prediction, reviews a decade of historical performance, and outlines what investors should watch heading into 2026.
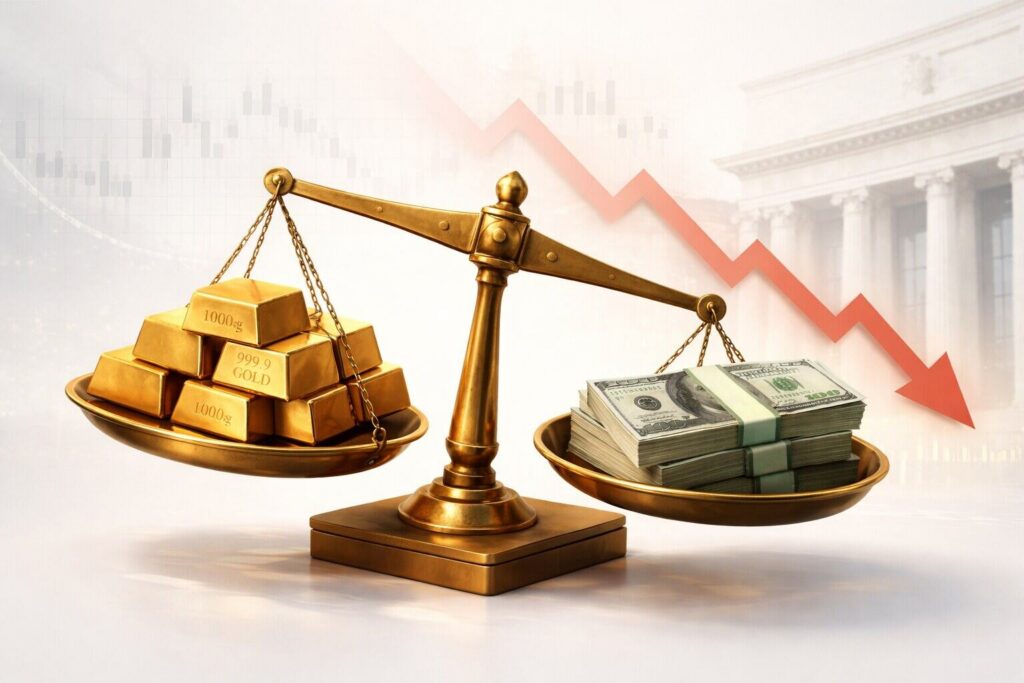
Dollar vs Gold Relationship: Why They Often Move in Opposite Directions
When the U.S. dollar weakens, gold prices typically rise — and vice versa. This inverse relationship between gold and the dollar is one of the most consistent patterns in global markets, driven by gold’s dollar-denominated pricing, competing safe-haven demand, and Federal Reserve interest rate policy. But the relationship isn’t absolute. Central bank gold buying, geopolitical risk, and shifting real yields can all disrupt the traditional correlation. Here’s what every investor needs to understand about the dollar vs gold relationship and what it means for your portfolio.
UBS Forecasts Gold Above $6,000 — Should You Buy Now?

UBS forecasts gold to rise 20% by end-2026, targeting $5,900–$6,200 per ounce. Learn what’s driving the rally, whether now is the right time to buy, and how to position your precious metals portfolio for maximum impact.
