 Silver Rises Over 120% YTD




China Imported 1,000+ Tonnes of Gold in Eight Months. Its Central Bank Bought Only 80.
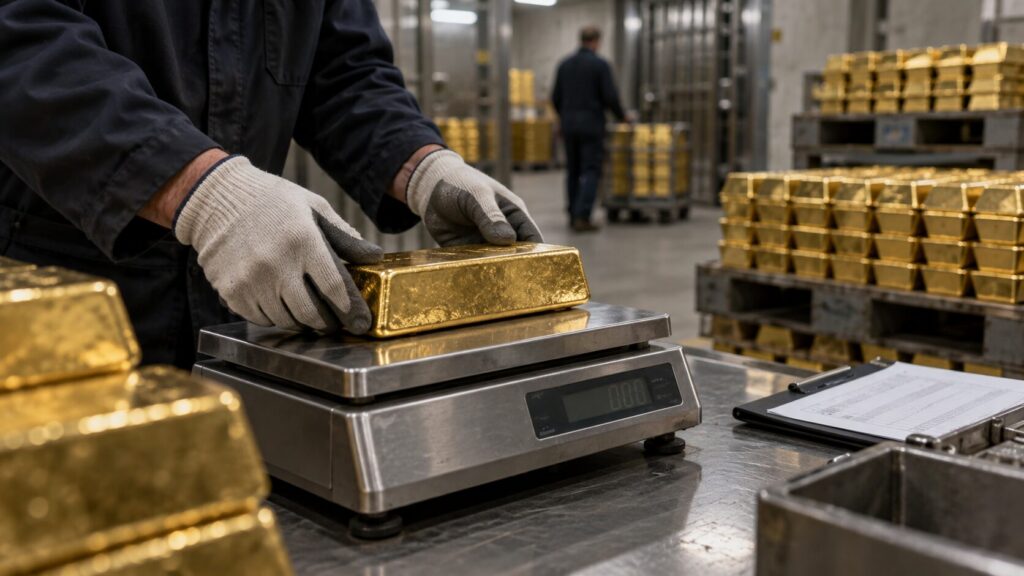
China’s central bank added just 80 tonnes of gold in eight months. So who imported the other 1,000-plus tonnes? A wave of household and institutional buying betting that gold is worth owning now, not later.
Why Jim Rickards Thinks $10,000 Gold Could Arrive by Mid-2027

Jim Rickards says gold’s climb to $10,000 an ounce comes down to arithmetic, not sentiment. He breaks down the anchoring effect, the fundamentals still in play, and why he calls the Fed’s latest rate hike a mistake.
Iran Hit a Tanker in Hormuz and Trump Threatened Iran. Oil Isn’t Reacting.

Iran hit a tanker in the Strait of Hormuz and Trump weighed a big decision on Iran, yet oil barely moved. Here’s the real-yield mechanism behind gold and silver’s muted reaction today.
Rates Just Went Up Twice. Five Reasons Gold Didn’t Care.
Two central banks hiked rates this week, and gold barely blinked. Five fresh signals — from Goldman’s models to a $4 billion sovereign gold shipment — show why institutional and sovereign money isn’t buying the bearish case.
The Bank of Japan Just Hiked to a 31-Year High. Gold Barely Noticed.
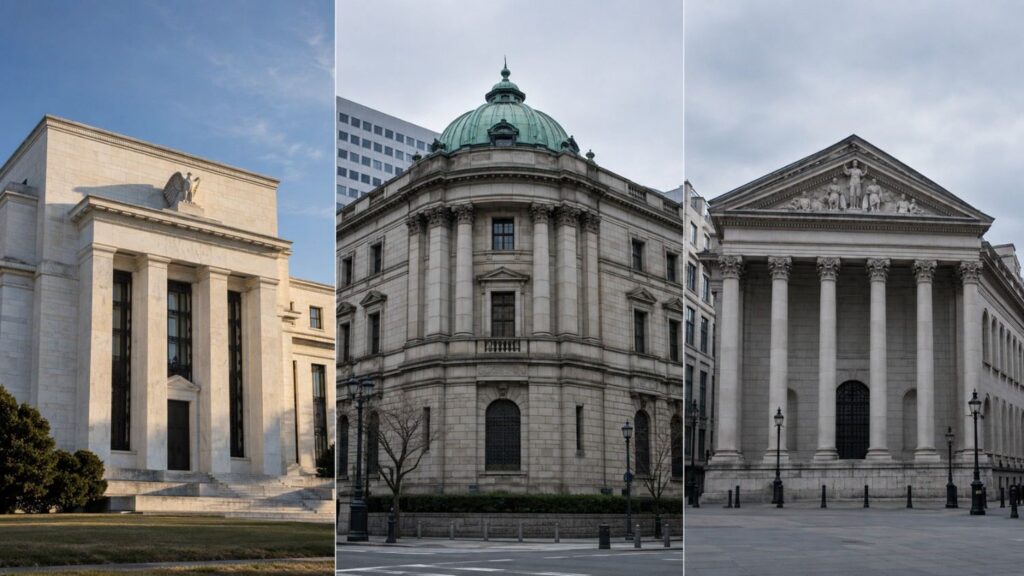
Three central banks moved three different directions this week, and gold barely blinked at the biggest one. Here’s the yen carry-trade mechanism behind Japan’s quietest 31-year-high rate hike, and why this time was different from 2024’s disorderly unwind.
The Fed Just Hiked. 16 of 18 Officials Say It’s Not Done.
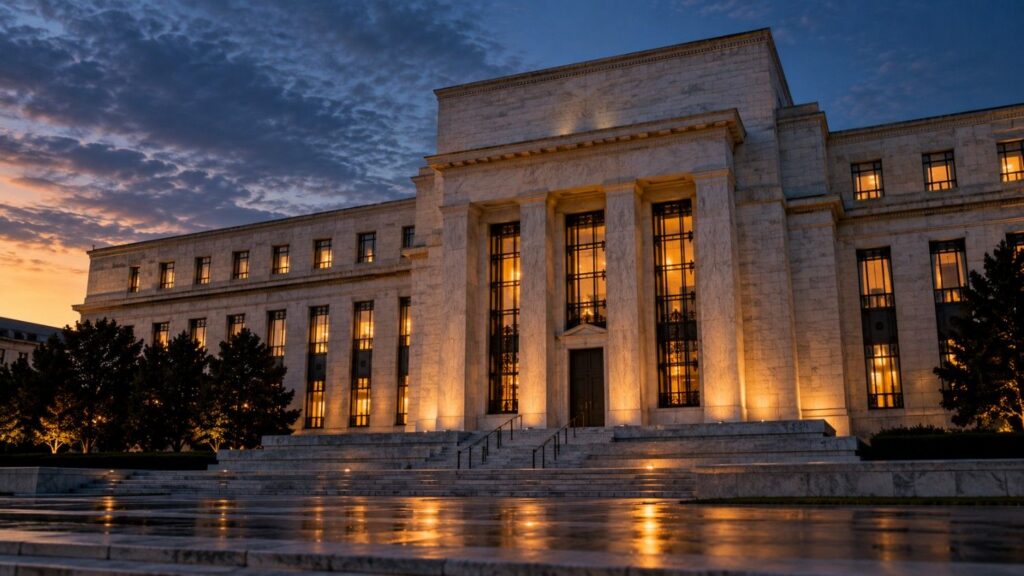
The Fed delivered its first rate hike since 2023, unanimously, moving the target range to 3.75%-4.00%. But 16 of 18 officials who submitted dot-plot projections still want more tightening this year — and gold and silver gave back their morning gains within the half hour.
Silver Is Outperforming Gold by a Third This Morning. The Fed Hasn’t Even Voted Yet.
Silver is beating gold by a wide margin this morning, running about a third larger a gain, hours before the Fed’s rate decision. Here’s the mechanism behind the divergence — and what to watch once the Fed actually votes.
The Fed Vote Is Already Priced In. These Five Things Aren’t.

Wednesday’s Fed decision is already priced into gold and silver. The real story this week is what’s happening underneath it — a positioning shift, an unreported buying gap, and more.
Gold Doesn’t Need a Rate Cut. It Needs What the Treasury Is Already Doing.

Six Treasury moves in six weeks, a Fed facility limit no one’s raised yet, and a Treasury Secretary calling himself ‘the house’ on the yen — GBI’s chief economist walks through what’s actually pushing gold, and how close it already sits to yield curve control.
Gold Just Ignored a War. Here’s What It’s Actually Watching.
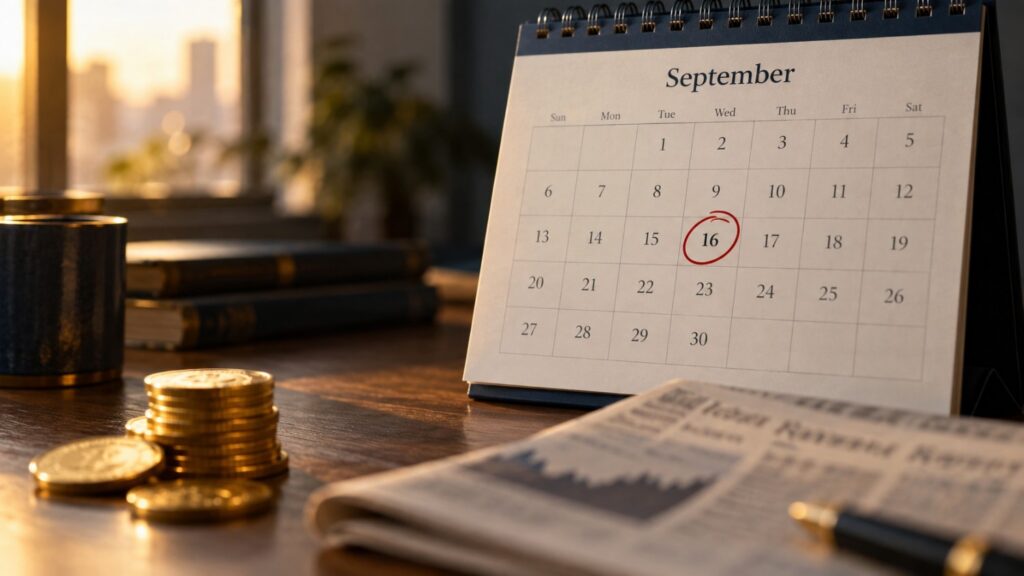
Gold and silver fell Monday even as a shut Saudi pipeline and a struck vessel in the Strait of Hormuz raised the stakes in the Middle East. The real driver: Fed rate-hike odds jumped to 86.5% two days before Wednesday’s decision.


