Gold & Silver Market Correction: Is the 2026 Bull Market Over?

Gold fell nearly 28% from its January 2026 all-time high. Silver dropped over 52%. Here is what caused the correction, why the structural bull case remains intact, and what central banks, the WGC, and institutional forecasters say about where gold and silver go from here.
What Is Purchasing Power — and Why Every Dollar You Save Is Slowly Being Taxed Away
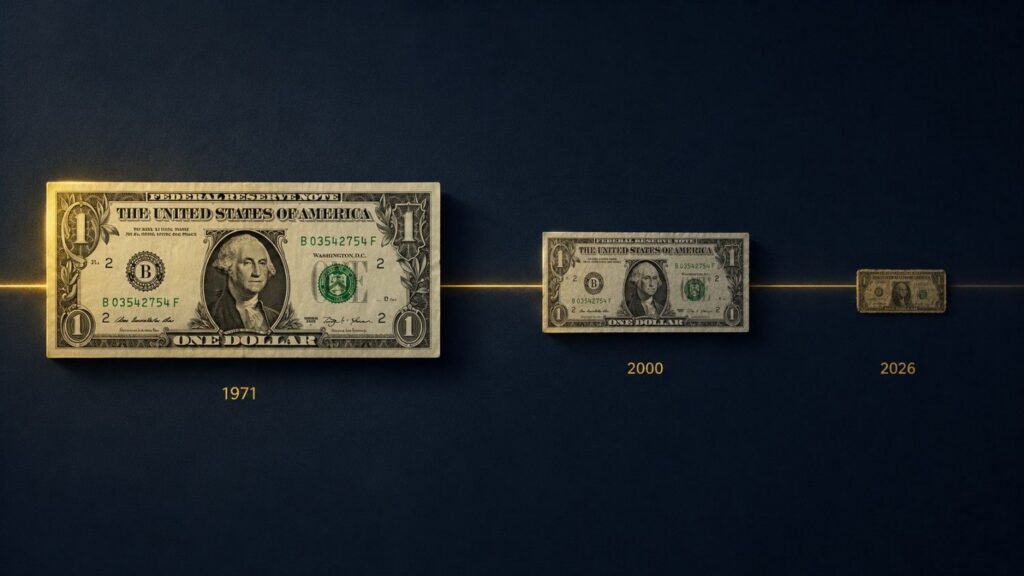
The dollar has lost 87% of its purchasing power since 1971. Learn what purchasing power actually is, why fiat currency erodes it, and why gold doesn’t.
China Just Bought Its Most Gold Since 2023. It Did It During the Quarter Gold Fell 16%.
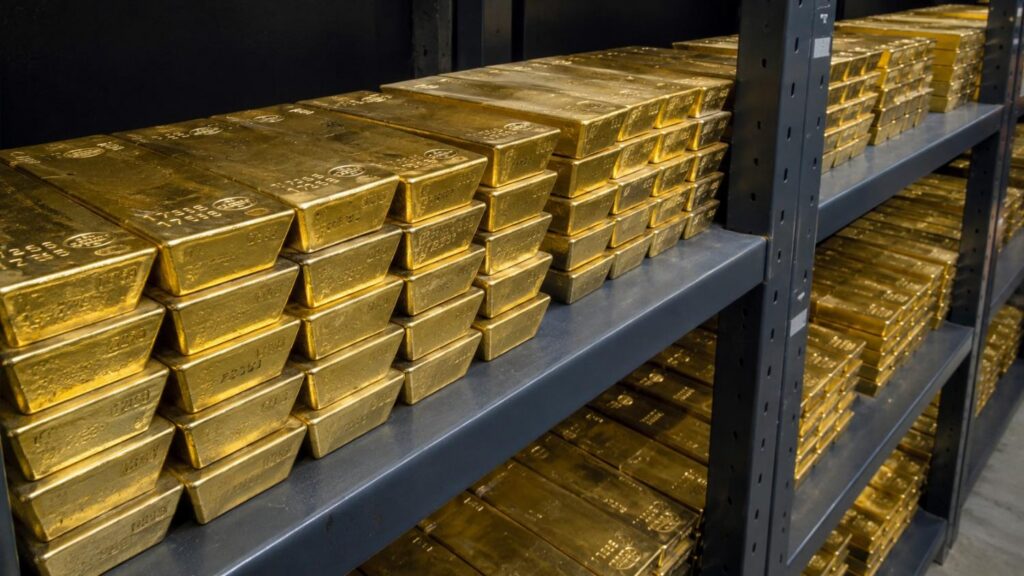
The People’s Bank of China added 14.93 tonnes of gold in June 2026, its largest single-month purchase since 2023 and its 20th consecutive month of buying. It happened during gold’s worst quarterly decline in thirteen years. Here is why the world’s most sophisticated reserve managers keep buying regardless of what the price does.
How Central Banks Decide How Much Gold to Hold
The World Gold Council’s 2026 survey asked 76 central banks how they decide how much gold to hold. The answer comes down to three objectives: safety, liquidity, and return — in that order. Here’s what that framework looks like in practice, why a record 45% of central banks plan to increase their allocation this year, and why the same logic applies to individual investors.
When Gold’s Price “Goes Up,” You’re Reading It Backward
When gold’s price rises, most people think gold got more expensive. They’re reading it backward. Here’s why gold as a store of value changes how you think about money and savings.
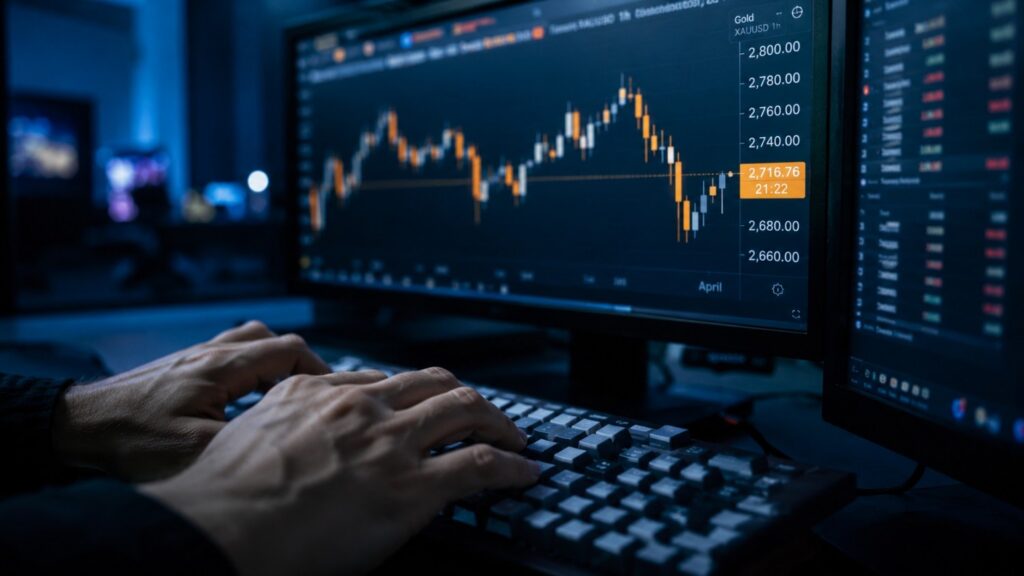
Gold Surges 1.5%: ADP, ISM, and Beige Book Trap the Fed

Five data points landed Wednesday that should have pressured gold. Instead, gold surged 1.5%. Each event tightens the same Fed trap — and gold trades on the trap, not the direction the Fed falls.
Central Banks Picked Gold Over Treasuries. Should You?
The ECB just confirmed gold leads global reserves for the first time since 1996 — ahead of US Treasuries. Central banks that could have rebalanced didn’t. Here’s the mechanism behind that choice, and what it means for individual savers.
Gold Price History: From $35 to $4,500 in 100 Years
Gold went from $35 in 1971 to around $4,500 today — a 12,000% gain since the gold standard ended. Meanwhile, the dollar lost 96.9% of its purchasing power over the same period. These are not two separate stories. This is the complete gold price history: decade by decade, the real cause behind every major move, and what a century of data tells investors right now.
What Backs the US Dollar? Not Gold. Not Silver.

Since Nixon closed the gold window in 1971, the dollar has lost 87% of its purchasing power. Here’s the structural mechanism behind that — and why it’s not reversible.
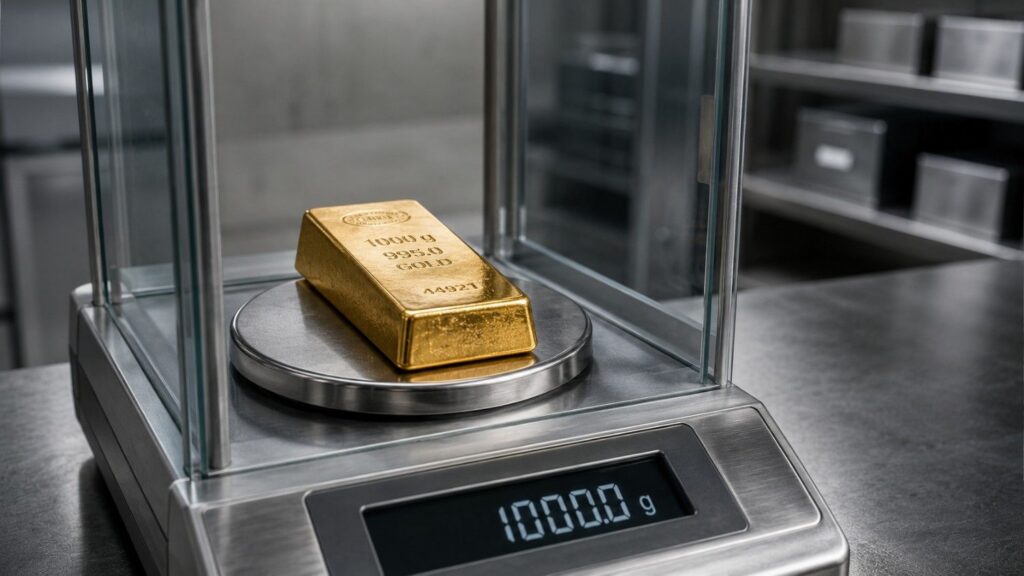
Why Is Gold Valuable? The 5,000-Year Answer Most Investors Get Wrong

Gold is valuable because no other element combines physical scarcity, chemical indestructibility, and 5,000 years of universal monetary recognition. Here’s the full explanation.
