Silver Rises Over 120% YTD


The Fed Just Named AI as Its Top Inflation Threat. Gold Noticed.

NY Fed President John Williams says AI-driven demand is now his biggest inflation concern — and that the Fed would “need to respond” if it persists. Here’s why that’s a gold story, not just a tech story, and what to watch before July 14.
Five Days From Now, Two Numbers Will Decide Gold’s Second Half
Gold is trading at $4,134 today as two market-moving events converge on Monday, July 14. June CPI drops at 8:30 AM ET. Fed Chair Warsh testifies 90 minutes later. Here’s the exact mechanism connecting both to gold and silver prices — and three scenarios for what happens next.
How the Jobs Report Moves Gold and Silver: The Five-Step Chain Behind Every Move
When the U.S. jobs report misses expectations, gold and silver prices typically rise. When payrolls beat, they fall. The relationship runs through a specific five-step chain — and once you understand it, the monthly reaction stops being a mystery.
Warsh Sat Out the Dot Plot. The FOMC Minutes Drop Wednesday.
The Federal Reserve releases the FOMC minutes from its June 16–17 meeting on Wednesday, July 8 at 2:00 p.m. ET. The committee came out nine to nine on whether to raise rates in 2026. Here is what the minutes will reveal — and why the real-yield mechanism makes them the most important data point for gold holders this week.
Gold Hits 3-Week High as Fed Hike Odds Halve on Jobs Miss
June’s jobs report added just 57,000 positions — less than half the forecast. Fed rate hike odds for July 29 fell to 22%. Gold hit a 3-week high. Here’s the mechanism.
The Jobs Report Missed. The Unemployment Rate Fell Anyway. Gold Didn’t Buy It.
Gold and silver rose after June’s jobs report missed and unemployment fell to 4.2%, but only because labor force participation dropped to a five-year low, not stronger hiring.
172,000 Jobs Doubled the Forecast. Thursday’s Report Could Move Gold Again.
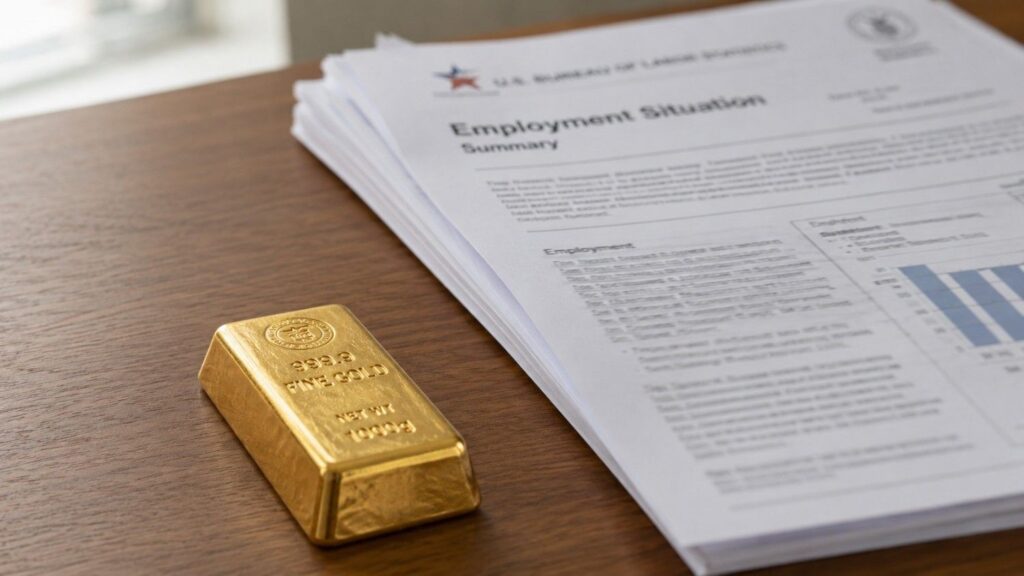
Every month, one government report moves gold’s paper price more than almost anything else. Thursday’s June jobs report is no different. Here’s the mechanism behind the move — and a three-scenario framework for what each outcome means for gold before 8:30 AM ET.
The Dot Plot Has 18 Dots. The Chair Withheld His.
The Fed’s June dot plot had 18 projections, not 19. Chair Warsh withheld his. The split is 9-to-9 — not the hawkish mandate markets have priced into gold.
Q1 GDP Beat. Jobless Claims Beat. Gold Rose. Here’s Why.
Strong GDP data is actually bad news for gold’s paper price. When the economy grows faster than expected, the Federal Reserve gains permission to raise interest rates — and higher rates increase the cost of holding non-yielding assets like gold. Here’s the mechanism, what June 25’s triple data release confirmed, and what it leaves unchanged for long-term holders.
PCE Drops Thursday. Here’s What It Means for Gold.
The Fed doesn’t watch CPI. It watches PCE — and the May reading drops Thursday, June 25. Here’s the mechanism linking this one number to gold prices, rate-hike odds, and what long-term holders need to understand before the week is out.