Silver Rises Over 120% YTD




The Fed Just Killed Its Rate Roadmap. Here’s What That Means for Gold.
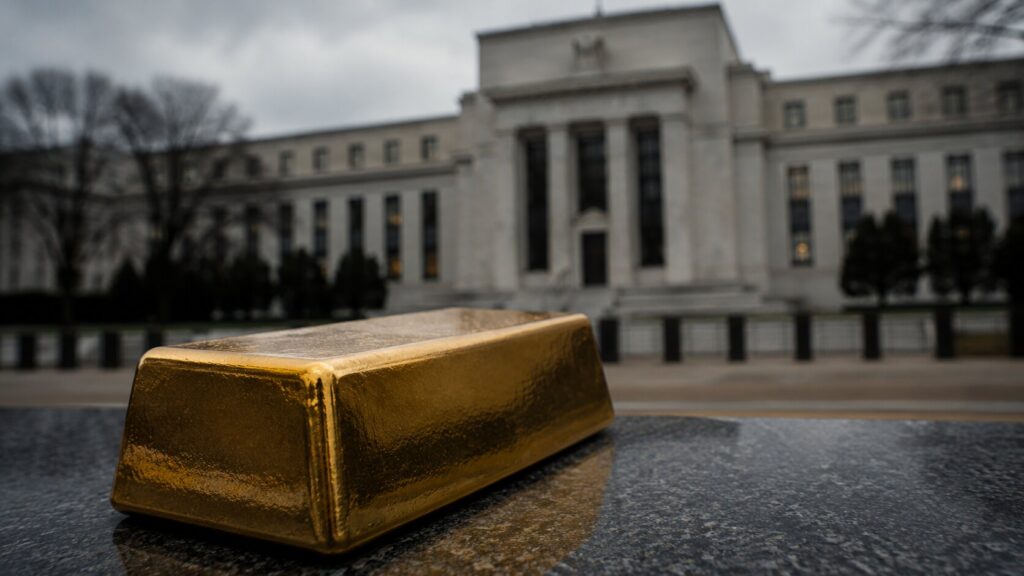
The Fed held rates steady. That wasn’t the story. Kevin Warsh withheld his dot plot entry — the first Fed chair in 14 years to do so — and quietly ended the forward guidance era that has guided markets since 2012. Here’s what that shift means for gold.
Iran Peace Deal Sends Oil Down 5%, Gold Up 3%

The Iran peace deal was supposed to hurt gold. It didn’t. Here’s why oil falling 5% is pushing gold higher — and what that tells long-term holders about the monetary chain driving precious metals right now.
Every Bearish Catalyst Landed at Once. Gold and Silver Went Up Anyway.

Every bearish macro catalyst landed today at once — hot PPI, an ECB rate hike for the first time since September 2023, and a second night of US-Iran strikes. Silver opened at its lowest level since December 2025. By afternoon it was up 3.6%. Here’s what that market signal means for physical holders and what to watch before the FOMC on June 17.
Gold Is Down 22% — The Same Drop as 2022. The Floor Is Not the Same.
Gold has fallen 22% from its January 2026 all-time high of $5,589 — the same magnitude as the entire 2022 Fed hiking cycle. But in 2022, the Fed delivered 525 actual basis points of rate increases. Today, markets are pricing roughly a 43–50% probability of a single speculative hike that hasn’t happened yet. Same number. Very different floor. Here’s what the gap between those two corrections is telling long-term holders of physical gold.
Gold Holds $4,481 With Rate Hike Risk Rising. Here’s the NFP Decision Map.
Gold is holding near $4,481 with rate hike risk rising — a divergence that, in any prior rate cycle, would have already sent gold lower. Tomorrow’s May jobs report is the last major data point before Warsh’s first FOMC meeting June 16–17. Here’s the three-scenario decision map: what a hot print, an in-line print, and a soft miss each mean for gold — and why the Fed’s policy trap makes the structural case for sound money regardless of Friday’s number.
Gold Surges 1.5%: ADP, ISM, and Beige Book Trap the Fed

Five data points landed Wednesday that should have pressured gold. Instead, gold surged 1.5%. Each event tightens the same Fed trap — and gold trades on the trap, not the direction the Fed falls.
PCE Hit 3.8%. GDP: 1.6%. Gold Went Up. Here’s the Mechanism.
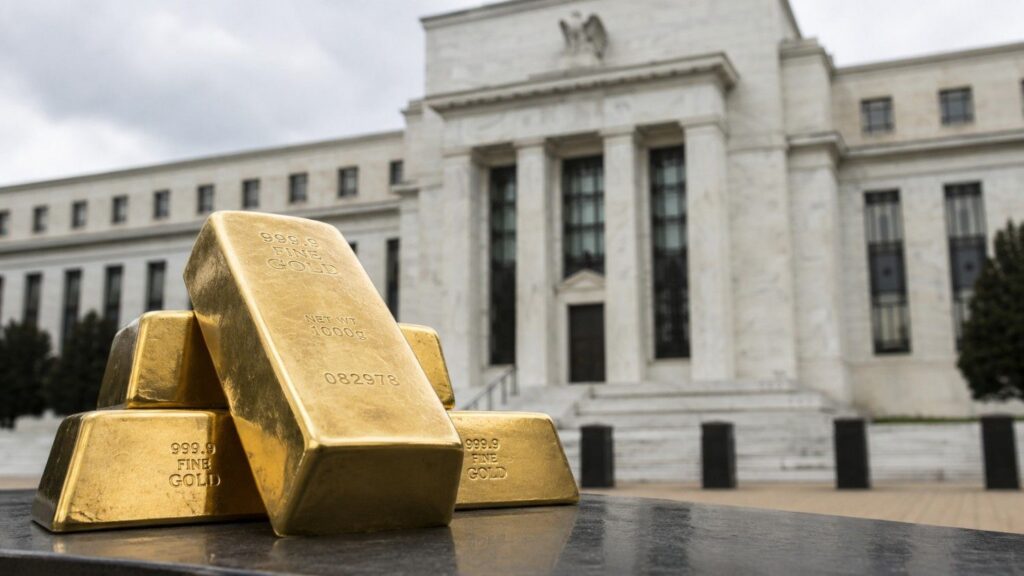
Yesterday’s BEA data confirmed what gold investors have been tracking all year: slow growth, hot inflation, and a new Fed chair with no clean policy options. Gold rose 1.5% on the day. Here’s why — and what comes next.
Why Your Savings Lose Value — And How Gold Fixes the Leak

Modern investing feels overwhelming because the system — not the investor — is broken. Fiat currency punishes savers, forces speculation, and creates the leaky bucket problem at the center of modern financial stress. Here’s what’s actually draining your wealth, and why gold may be the simplest way to fix it.
Gold Won’t Break. The Fed Just Told You Why.
The Fed just released its most hawkish minutes in over a decade. December rate hike odds hit 40%. The dollar surged. Gold barely moved. That non-reaction is not confusion — it’s the market pricing a structural ceiling on how far this Fed can actually tighten. Here’s the mechanism behind it.
The Real Reason Gold Falls When Inflation Surges
April CPI hit 3.8% — and gold dropped. If that feels backwards, it should. Here’s the chain: hot inflation forced traders to reprice the Fed toward rate hikes, which lifted the dollar, which pressured gold. The short-term mechanics and the long-term case are two different things — and today is a perfect illustration of why.