 Silver Rises Over 120% YTD




What Does an Inverted Yield Curve Mean for Gold Prices — and How Do You Use It?

The bond market’s most reliable recession warning has a direct connection to gold prices. Here is the mechanism — and what it means for your portfolio.
Gold Needed One Thing to Break $4,400. It Just Got Five of Them.
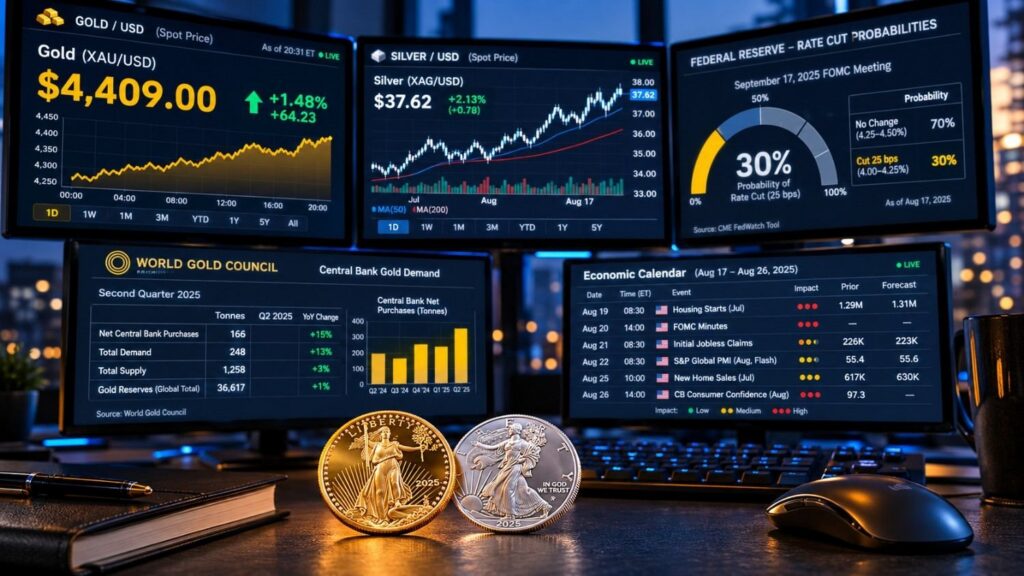
Five distinct market developments on August 17 point to the same conclusion: the policy ceiling holding gold below $4,500 is crumbling faster than most investors expected.
Gold Rebounds to $4,392 as Sentiment Crashes to 51 and Inflation Expectations Rise

The University of Michigan’s August Consumer Sentiment Index fell to 51 — missing the 54.5 consensus and ending two months of improvement — while inflation expectations rose to 4.3%. The simultaneous drop in growth confidence and rise in price expectations creates a stagflation signal that limits the Federal Reserve’s options and extends gold’s tailwind heading into September.
The Fed’s September Math Just Changed. Here’s What It Means for Gold.
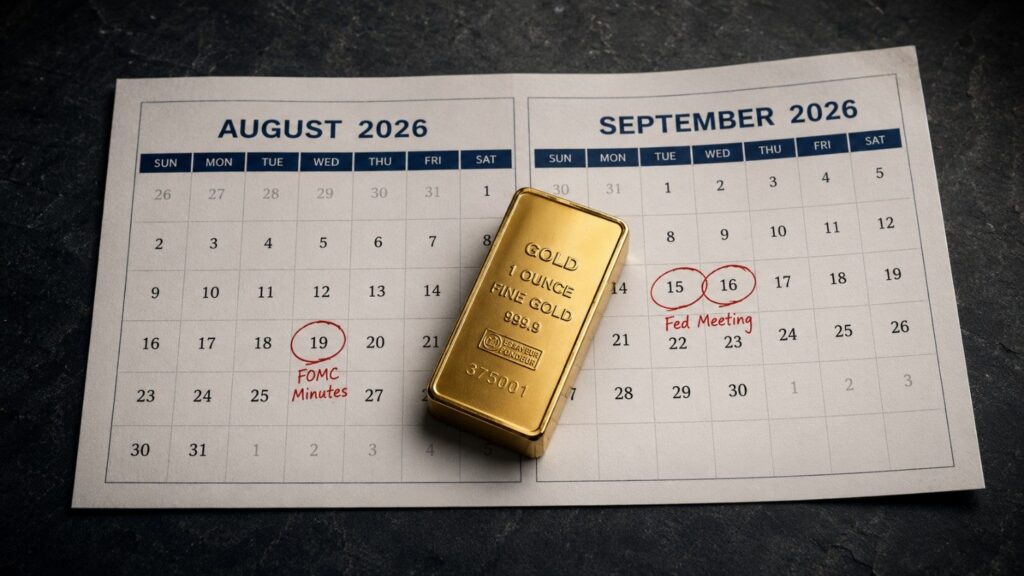
Two soft inflation prints shifted the Fed’s September rate-hike odds from near-even to 69.4% hold. Here is the real-yield mechanism driving gold’s move this week — and why the FOMC minutes dropping Tuesday are the most important data point between now and September 15.
Jackson Hole Is 14 Days Away. What Warsh Says Could Move Gold More Than Any Inflation Print.

Fed Chair Warsh calls Jackson Hole a chance to frame “the big questions.” Here’s the real-yield mechanism that makes his August 27 speech the most important gold catalyst of the month.
Gold Hit a Two-Month High. Then It Pulled Back. The PPI Data That Caused Both Moves Is What Matters.
Gold hit a two-month high on Wednesday, then gave back ground Thursday as energy costs complicated an otherwise clean inflation signal. PPI came in flat. September Fed hike odds fell to 40%. ETF money is returning. Citi put a $90 target on silver. Here are the five developments shaping precious metals right now.
Two Soft Inflation Prints. Gold Is Still Below $4,500. One Number Is Keeping It There.
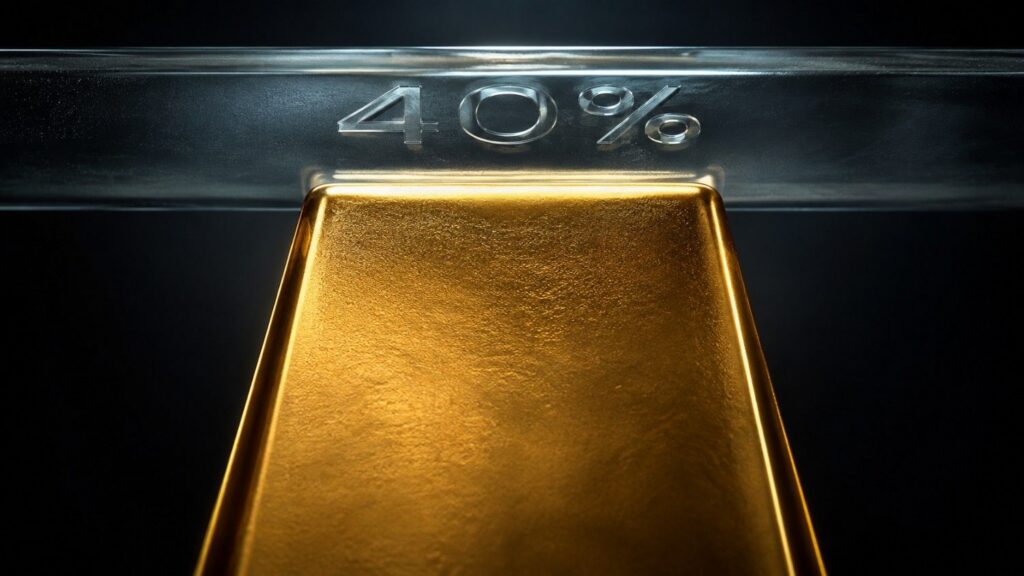
Two consecutive soft inflation prints — July PPI flat, CPI up just 0.1% — should be pushing gold through $4,500. Here is the one number keeping the ceiling in place, and the threshold to watch for when it lifts.
The Economy Lost 23,000 Jobs. Gold Climbed Toward $4,400. Here’s the Mechanism.

When the US economy loses 23,000 jobs and gold climbs toward $4,400, most investors are confused. Here is the exact monetary mechanism that explains why a bad jobs report is consistently good for gold — and why the composition of this rally makes it more durable than most.
China Bought the Most Gold Since 2023 in July. Here’s Why.
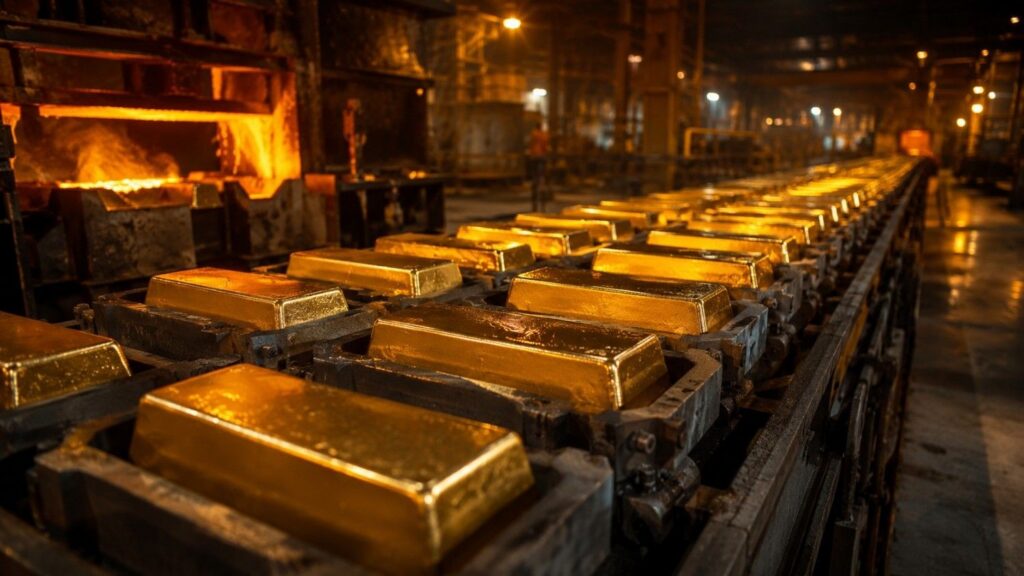
China’s central bank just recorded its largest single-month gold purchase since October 2023. The number is notable. The structural reason behind it — a 19-percentage-point reserve allocation gap that no short-term price move will close — is what every gold owner needs to understand.
Two Inflation Numbers Come Out Every Month. The Fed Only Cares About One.
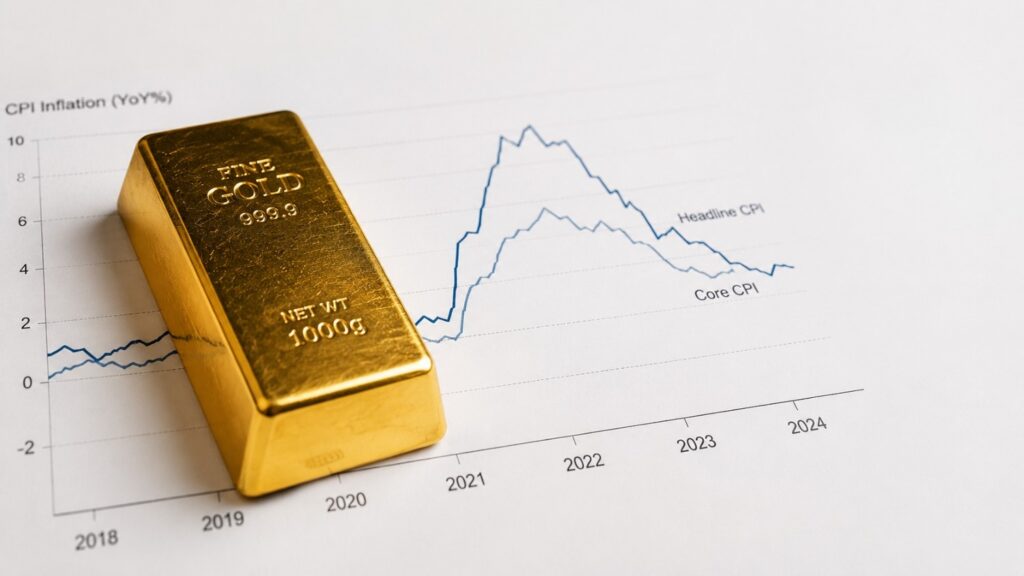
The Fed releases two inflation numbers every month — headline CPI and core CPI. They tell very different stories, and the Fed only acts on one of them. Here is what each measure captures, why the Fed leans on core PCE to set interest rates, and why that gap between what you pay and what the Fed watches matters for gold investors.


